March 31, 2014

How to beat the market by throwing darts

During some recent research I noticed that picking random stocks in the SP500 produced returns much better than I would expect. This observation was recently echoed by another researcher that I know. Could one make a market beating system by basically randomly pick stocks?

The research that led to this observation was on market timing. Can having a good market timing rule, a profit target and stop loss be enough to randomly pick stocks and beat the market. The answer may surprise you.

Testing Parameters

Test date range is from 1/1/2004 to 12/31/2013. Entry an exit are done at the close. Maximum number of open positions is 10.

Market Timing Rules Tested

  • Close is above 200 day moving average (MA200)
  • The 252 day return greater than zero (ROC)
  • Close is in the top 75% of the 252 day range of closes (Closing Range)
  • The 3 month (63 day) HV of the SPX ix in the bottom 60% of the prior 252 (HV Range)
  • The 50 day moving average is above the 200 day moving average (Golden Cross)


All the rules apply to the SPX. Random entries are allowed when the market timing rule is true. Positions are not exited when the market timing rule goes from true to false. The stock exits when one of the sell rules trigger.

Buy Rules

  • Market Timing rule is true
  • Randomly pick stocks from the S&P500 until reach 10 positions

Sell Rules

  • 2% intraday profit target
  • 10% intraday stop loss

These values were chosen off the top of my head. I did not try any other parameters.

Base Results

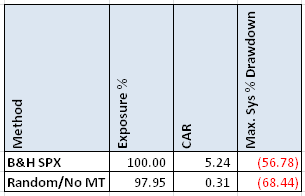
140331A

For the base results we have two methods. One is buying and holding the S&P500 index. The other is randomly choosing stocks and using the exit rules. Now we have are targets to beat. Time to add some market timing rules and throw some darts.

Market Timing Results

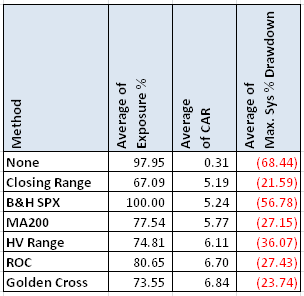
For each of the market timing methods, I ran a Monte Carlo simulation of 250 runs.

140331B

Several of the market timing rules beat Buy and Hold with significant reduction in the maximum drawdown. Over the years, my research has shown that market timing improves a system by being out in the bad times and this confirms it.

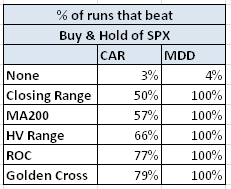
The next table shows the percent of runs that beat Buy and Hold’s CAR and Drawdown.

140331C

Here one can see that the Golden Cross and ROC market timing methods really shine by beating B&H CAR over 75% of the time while always having a lower drawdown.

Spreadsheet

If you’re interested in a spreadsheet of the data used to generate these tables, enter your information below, and I will send you a link to the spreadsheet.  The spreadsheet includes yearly breakdown and minimum and maximum values for the Monte Carlo runs.

Conclusion

One can beat buy and hold using simple market timing method, basic exit rules and throwing darts. Would I trade this way? No. But this sets a bar for research. One could have easily picked a ranking method and came up with these market beating results. It would have seemed impressive until one realizes that the random method does just as well. Good luck on your dart throwing,

Backtesting platform used: AmiBroker. Data provider:Norgate Data (referral link)

 
Visited 31 times, 1 visit(s) today

Click Here to Leave a Comment Below

Mike - March 31, 2014 Reply

I think you left out the sell rules?

    Cesar Alvarez - March 31, 2014 Reply

    Thanks for catching this. Somehow they ended up in the Buy rules when I copied the article from my Word document. Strange.

mhp - March 31, 2014 Reply

It would be interesting to also show the results of buying SPX (or SPY) with 100% of equity using each of the timing rules and the same target/stop exit rule. That might shed light on how much of the improvement comes from timing and how much from (random) stock picking.

    Cesar Alvarez - March 31, 2014 Reply

    That is a good idea. I will put that on the list for a future post.

Darren - March 31, 2014 Reply

It would be interesting to show the results with predictive fundamental ratios as market timing inputs such as:

(1) Price Valuation, Ratio of Enterprise Value (EV) to Earnings before Interest, Tax, Depreciation, Amortization (EBITDA). If a stock’s price is too high wrt earnings, then there is not enough capacity for short term growth.
Lower Value <= 8, is a good price.
(2) Price Valuation, Ratio of Price to Free Cash Flow.
(3) Profitability, Return on Invested Capital (ROIC)

have you tried this before, do you think this has value?

    Cesar Alvarez - March 31, 2014 Reply

    Darren,

    I would love to test those ideas. But unfortunately I do not have historical fundamental data.

Fred - March 31, 2014 Reply

I think you should note if you are accounting for survivorship bias. As you are aware, if one conducted this experiment using the current S&P 500 stocks the conclusion would be erroneous.

Karolis - April 1, 2014 Reply

What about S&P being market cap weighted and your trades being equal weight? With that you are on average giving more weight to smaller market cap stocks which are known to produce higher returns than S&P500?

    Cesar Alvarez - April 1, 2014 Reply

    That is true and could account for some of the difference. I believe there is and equal weight ETF. I should hunt that down for a comparison.

AZ Trotter - April 14, 2014 Reply

Why not provide the amibroker code? Thanks.

    Cesar Alvarez - April 17, 2014 Reply

    The code would not be of use without the data that I use, which I cannot share. If you have AmiBroker questions, I am always happy to answer questions.

Steven Gabriel - April 23, 2014 Reply

I love this test. It really shows how important the general market filter rule can be. In essence, I suspect that a lot of traders who do well with their stock picking for periods of time are really just capturing these time frames when the market volatility is low (which is what several of these filters look for either directly or indirectly). It would be easy to deceive oneself that one is a good stock picker because as you have shown–just throwing random darts works during these time frames.

It seems that just finding the times that the wind is at your back sort of trumps other individual stock details/filters in terms of performance.

very powerful

Marco - September 29, 2014 Reply

I believe the only problem with these general strategies is that leverage cannot be applied because of too large drawdown…
http://nightlypatterns.wordpress.com

Leave a Reply: