- in General , Mean Reversion , Research by Cesar Alvarez
Indicator Comparison: Ehler My Stochastic Indicator, RSI and ConnorsRSI
Like all traders, I am always on the lookout for any new indicators better than the ones I am using. I have been using and promoting RSI2 since 2004 for mean reversion trading. I created the ConnorsRSI in 2012. Am I married to these indicators? No. If I find something ‘better’ I will drop them. I came across this article Battle of the oscillators, I had to try it out.
One thing to understand, is that each situation is different. An indicator that works great on ETFs may work not as well on futures. Also, each person has a different metric on what is ‘better.’
The Test
The rules for the strategy will be simple. The testing universe is the Select Sector SPDR ETF (XLY, XLP, XLF, XLE, XLV, XLI, XLB, XLK, XLU) from 1/1/2007 to 6/30/2017.
Ehler My Stochastic Indicator (EMSI)
You can find the code for the indicator at Predictive Indicators. I will also provide AFL code to download. Fill in the form below. I tested several lengths because I did not know what would work best. I went down to as low as 2 because that works well for RSI.
Entry
- When ESI(2,3,4,5,10,15,20) is less than (10,15,20,25,30), enter on next open. Buy 11.1% of the ETF
Exit
- When ESI(same length as entry) is greater than (60,65,70,75,80,85,90), exit on next open
RSI
Entry
- When 2 period RSI is less than (10,15,20,25,30), enter on next open. Buy 11.1% of the ETF
Exit
- When 2 period RSI is greater than (60,65,70,75,80,85,90), exit on next open
ConnorsRSI
Entry
- When ConnorsRSI(3,2,100) is less than (10,15,20,25,30), enter on next open. Buy 11.1% of the ETF
Exit
- When ConnorsRSI(3,2,100) is greater than (60,65,70,75,80,85,90), exit on next open
Comparisons
There are many ways one could compare these. I have chosen, Compounded Annual Return, Sharpe Ratio, Risk Adjusted Return and % Winners. I ran an optimization on each and then chose the best one for each metric.
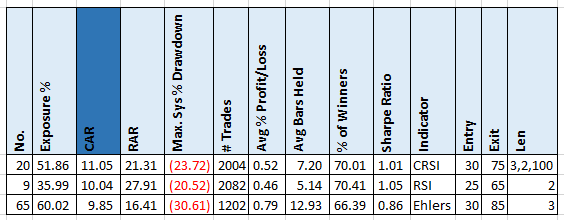
Compounded Annual Return
ConnorsRSI has the best CAR but RSI is very close by. With EMSI a little bit behind but with a higher MDD.
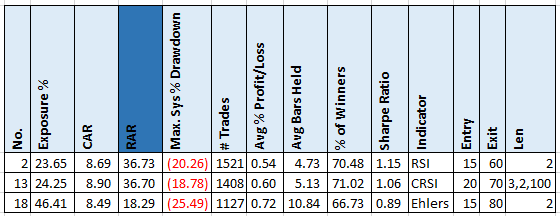
Risk Adjusted Return
Risk Adjusted Return is the “Compounded Annual Return” divided by the “Exposure %.” I like this metric because it adjusts for time in the market. To avoid variations with very little exposure which then inflates CAR, I added a minimum CAR of 8%.
This time RSI wins by a bit over ConnorsRSI. With EMSI significantly below.
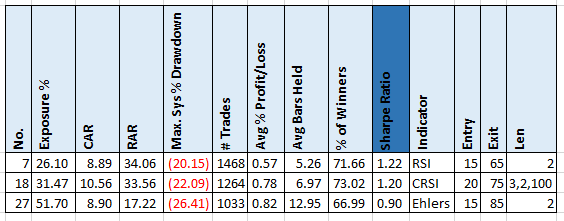
Sharpe Ratio
A popular metric among traders.
Again, RSI wins by a bit over ConnorsRSI. With EMSI significantly below.
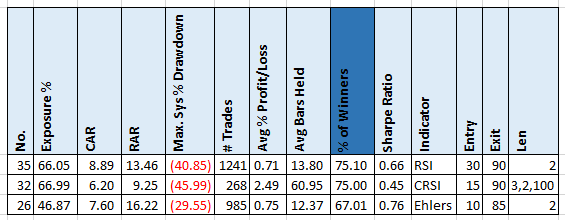
% Winners
Some people like strategies with high % winners.
Again, RSI wins by a bit over ConnorsRSI but it has a much longer average hold. With EMSI below with the shortest hold.
Spreadsheet & Code
Fill the form below to get the spreadsheet to see the results of these tests. See year by year returns and other values for entry exit and length. Also included in the download is the AmiBroker code for the Ehler My Stochastic Indicator.
Final Thoughts
These results differ from the results from the blog post I read. Does that mean their results are wrong? No. It all depends on the strategy, the parameters and your metrics. For my type of trading, it appears that Ehler My Stochastic Indicator does not perform as well as RSI or ConnorsRSI. Does that mean I will not use? No. It shows promise. Maybe using it as a confirmation to an RSI signal. What I like about it is that it is different and not everyone knows about it and is using it.
Backtesting platform used: AmiBroker. Data provider: Norgate Data (referral link)
Good quant trading,

Fill in for free spreadsheet:
![]()


