Is mean reversion dead?

My great friend and expert trader Steven Gabriel often pushes me to answer this question; and prove it. We, perhaps too fondly, remember the great mean reversion trading years of 2005, 2006, 2008, 2009, 2010. We discussed this topic often in 2011 and 2012. Steven Gabriel would often call me on days when in the past, we would both be making 5+% on a day that our stocks would be mean reverting, but now we would be making a mere 1%.

My theory is that mean reversion is in hibernation waiting to come back; or said another way, mean reversion is simply mean reverting. I think that when too many people trade mean reversion, the space gets crowded and we see fewer winning trades and smaller returns. However, this has always been conjecture never backed up with numbers. Are we really seeing fewer trades? Smaller returns? Time to do the research and see what the numbers tell us.

The Test

Testing Universe: Top 1,000 stocks by dollar-volume with closing price greater than $1. No ETFs included.

Date Range: 1/1/2001 to 8/30/2013

Entry:

  • RSI(2) < 5
  • Entry on Close


Exit:

  • RSI2 > 70
  • Exit on Close


I performed an “All Days” test. This means we can have multiple entries in the same stock at the same time. In a situation where an oversold stock continues on a journey downward day after day-the test will take each trade each day as a new independent trade if the stock continues to meet the filter criteria.


The Results

Number of trades

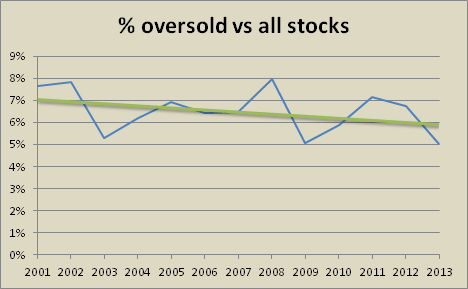
The first question is as a percentage are there fewer stocks becoming oversold?

RTM-Dead-Oversold

The blue line is the percent of stocks with RSI2 < 5 compared to all the stock for a given year.  This has hovered between 5.1% in 2009 and 8.0% in 2008. The green line is a liner regression of the data. We can see that the trend has been down since 2001 but not a lot.  The trend from 2005 to 2007 compared to the trend from 2011 to 2013 looks very similar. Is this trend because we are in the same cycle of a bull market? Is mean-reversion in hibernation? Given the trade data, I would say yes. Nothing appears out of the ordinary.

Average % profit/loss

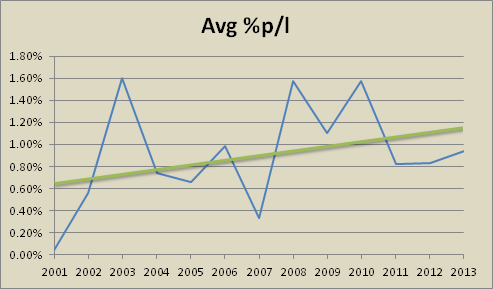
What has been happening to average % profit/loss over the years?

RTM-Dead-PL

This chart surprised me. The blue line is the average % profit/loss of all the trades with RSI2 < 5 and the exiting when RSI2 > 70. The green line is a linear regression of the data. The last thing I expected was an up sloping linear regression line. The 2013 average % profit/loss is .94% substantially less than the 2008 and 2010 values of 1.58% and 1.57% respectively. But 2013 returns are higher than 2011 and 2012 and substantially higher than 2007’s value of .33%.

Conclusion – Mean Reversion is coming out of hibernation

We are at the low of the number of sold off stocks per year but the average # profit/loss is the middle range. The numbers do not tell me anything is out of whack with mean reversion. Mean reversion is not dead but it looks like it is coming out of hibernation. I have more ideas on how I want to slice this data and additional tests I will be doing over the coming weeks.

So, there you go Steven.  Mean reversion is not dead, but it has been sleeping and it appears that it is ready to come out of hibernation.

Comments, suggestions or ideas on further tests on this topic?  Put them in the comments window below!

Backtesting platform used: AmiBroker. Data provider:Norgate Data (referral link)

Visited 47 times, 1 visit(s) today

Click Here to Leave a Comment Below

MP - September 21, 2013 Reply

Just confirming: you are using a survivorship-bias free dataset, right? One other possible area to research: have the oversold instances become more clumped together over time? That is, less spread out and more likely to occur on the same day.

    Cesar Alvarez - September 21, 2013 Reply

    Yes, I am using a survivorship-bias free data from CSI Data. The data has delisted stocks, is adjusted for dividends and capital gains. That is an interesting idea about he clumping. I would need to think about how I would do that to make comparisons meaningful.

      MP - September 21, 2013 Reply

      One related thought would be to check for avg. RSI(2) reading of SPY when stocks are triggered. That would help differentiate opportunities driven by overall market weakness vs. those driven by stock-specific moves. Some kind of RSI(2) that is relative to the overall market, rather than absolute.

Mark Roth - September 22, 2013 Reply

Cesar: If you are able to check out the work by Toby Crabel, you will find that his work shows volatility itself is mean reverting. Thus periods of high volatility (very active mean reversion to my way of thinking) are followed by periods of lower volatility (less active mean reversion) and vice versa. My thought is also that Larry’s abandonment of RSI2 is a positive to the extent that it removes those traders from the market place.

Jeff - September 22, 2013 Reply

Welcome to the blogosphere Cesar, a welcome addition.

Rob Davenport - September 23, 2013 Reply

Cesar,

Excellent post! I look forward to your future blogs.

I would be interested in the following two research projects:

(1) Oversold stock performance in different VIX bands. For instance, you might look at RSI2 < 5 in VIX bands: 25. There may be a better way to set up this experiment – this is just a thought.

(2) Based on the recent blog in QE, it would be interesting to look at buying a stock x days after either 5-days of consecutive new highs or RSI2>99.

steven - September 24, 2013 Reply

I agree that mean reverting is mean reverting, but my suspicion is that stocks will not be reverting to their mean as fast as they did in the past. And, if the stocks do mean revert slower, the magnitude of the stocks movement back towards its’ mean will be smaller because some of the stock’s reversion will occur because of time (not price).

Brian - September 26, 2013 Reply

along Rob D. lines- what about when SPY <200dma or above or below 50dma etc?

Or, segregated by different trend strengths of the market TSI SPY at various levels?

Optimize by TSI or ATR and that ought to yield interesting 3d graph.

Great to have you blogging btw Cesar.

Ronen - October 3, 2013 Reply

The linear regression line for the % of stocks oversold and average p/l % seem to be diverting. This is telling me that there are less opportunities, but the profits have been increasing. I think it would be helpful to post either monthly or quarterly updates to the graphs above, so as to get a gauge on how mean reversion is progressing. Perhaps, we are slowly moving towards a trending market. This is something we haven’t seen in a while.

This is a great post!

Is mean reversion dead – reader suggested research » Alvarez Quant Trading - October 24, 2013 Reply

[…] article on “Is mean-reversion dead?” produced lots of suggestions from readers on other tests to try. We will jump right in and look […]

PV - September 9, 2014 Reply

What about if the graphs are just showing noise? That’s maybe just how a 12 year period normally looks. The important part to remember is that the edge is there the whole time. No one will admit they want a straight equity curve but that’s what we all keep looking for. I think it’s good to check there is an edge but to use the 12 years to predict the next few is very much akin to hopping on red after 4 blacks. I think what we should be trying to do is shifting the entire avg P/L curve up and increase the trade frequency. You can probably increase the P/L by holding winners longer and increase the trade frequency by accepting smaller dips in a bull market.

Marco - September 20, 2014 Reply

I believe the strong mean reversion we experiend during the years mentioned above is mainly due to the strong effect internet and computers had on the traders community. Not as before 2000, now nearly everybody can daytrade and the markets volumes and daily ranges increased a lot. Nearly everybody get access to instant news flow, that’s why each event’s time window shortened so much helping so mean reverting regime and not trend following. This is what I discovered in my overnight trading too:
http://nightlypatterns.wordpress.com

    Cesar Alvarez - September 20, 2014 Reply

    Interesting theory. I can tell you that mean-reversion results in the late 90s were incredibly great.

The Health of Stock Mean Reversion: Dead, Dying or Doing Just Fine | Alvarez Quant Trading - August 19, 2015 Reply

[…] second post on this blog was a look at mean reversion, Is mean reversion dead? Given I am using a new data provider(Premium Data), it has been almost two years since that post […]

Rego - August 2, 2016 Reply

Great post. I wonder what could be the results not for the whole universe of not penny stocks, but only for the stocks which have success in ADF test. I mean, if still there are several stocks with quasi-stationary prices, we could expect that they still could be good examples of good profits with Mean Reversion strategies, right?

Matthew Wills - September 9, 2018 Reply

Hi Caesar,

Whilst this post is a little old, I wonder what your opinion of mean reversion is given the current market dynamics.

Over the last 3 years and in particular the last year (2018) mean reversion seems to be faltering, all of my systems have performed well below par w.r.t. 2010 – 2015.

Are your systems performing well or are they deteriorating?

Is mean reversion dying?

    Cesar Alvarez - September 9, 2018 Reply

    Mean reversion likes volatility and then has not been much of that the last few years. I have seen smaller numbers in my MR strategies too. Maybe at the beginning of 2019, I will do another analysis of the state of mean reversion.

Leave a Reply: