- in Mean Reversion , Research , Stocks by Cesar Alvarez
Is mean reversion dead – reader suggested research
My article on “Is mean-reversion dead?” produced lots of suggestions from readers on other tests to try. We will jump right in and look at what these research suggestions produced.
Test Rules
Testing Universe: Top 1,000 stocks by dollar-volume with closing price greater than $1. No ETFs included.
Date Range: 1/1/2001 to 8/30/2013
Entry:
- RSI(2) < 5
- Entry on Close
Exit:
- RSI2 > 70
- Exit on Close
VIX Ranges
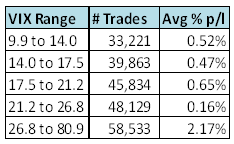
Rob D. suggested looking at the oversold stock performance in different VIX bands. From 2001 to 2013, the daily VIX values are divided into five equal sized buckets. From this, we have five ranges to compare against to for our test of entering a stock when RSI2 < 5 and exiting when RSI2 > 70.
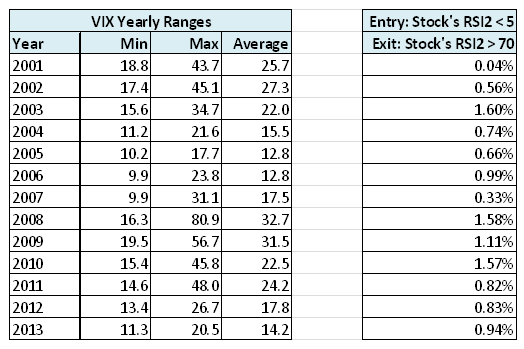
Good mean reversion returns tend to happen when the VIX is greater than 26.9. Now we will look at the VIX over the years and the average %p/l of oversold stocks.
Weak correlation exists to higher VIX leading to higher returns but it is not very strong. I don’t see the VIX being a strong predictor to mean reversion returns.
Hold Periods
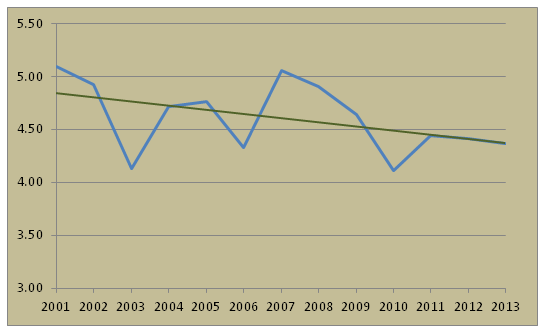
Steven G. suggestion was to look at the average hold period of the oversold stocks over the years. His theory being that holds are getting longer, which was my theory too.
As we can see from the trend line, it is getting shorter. Are holds getting shorter because more people are trading mean reversion?
Big Winners and Losers
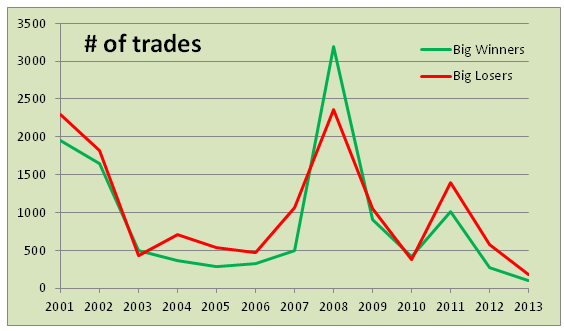
From another reader, he wanted to know if the number of big winners and losers are declining over the years. I defined big winners as a trade that made more than 10%. A big loser is a trade that lost more than 10%. An intriguing idea.
The trend is down for both big winners and big losers. This year, 2013, is on track to have the least big winners and losers since 2001. Steve and I have been commenting that we have seem to be getting less big winners and now it is confirmed by the numbers.
Spreadsheet of Results
If you’re interested in a spreadsheet of my testing results, enter your information below, and I will send you a link to the spreadsheet. The spreadsheet contains the tables used to generate the charts and some additional information not in the post.
Backtesting platform used: AmiBroker. Data provider:Norgate Data (referral link)
Comments
One suggestion, that I did not get to today, was to look at only when stocks are above the 200 day moving average. This idea will be a future post. Keep your comments and testing ideas coming.


