- in Research , Stocks , Trend Following by Cesar Alvarez
Low Volatility Stocks and Profit Targets
In the two previous posts, we have looked at low volatility stocks vs. high volatility stocks with trailing stops. Overall, the data pointed to trading lower volatility stocks. In this post, the focus is on low volatility stocks but now adding profit target stops to see how they can improve the results.
Trailing Stops
The following profit targets will be tested.
- (10, 20)% percent stop
- (2,4)x ATR10 Stop
- (2,6) Month Stop
Profit Targets
The following profit targets will be tested.
- None
- (20,40)% target
- (2,4,6)x ATR10 target
The Test
Date range from 1/1/2004 to 12/31/2013.
Buy Rules
- Stock has 21 day moving average dollar-volume greater than 10 million over the last 3 months
- Close is greater than $5
- Six month return is greater than 10%
- Close is greater than the 200 day moving average
- The SPX close is above the 200 day moving average
- The stock’s 100 day historical volatility(HV100) is between 20 and 35 for the last 5 five days
Buy rules 1 & 2 are liquidity rules. Rules 3 &4 are a simple way to determine that the stock is an uptrend. Rule 5 is our market timing rule. Since we are trading longer term, we want the market wind at our back.
Sell Rules
- One of the Trailing Stops
- One of the Profit Targets
Each of these sell rules will be tested independently.
The Results
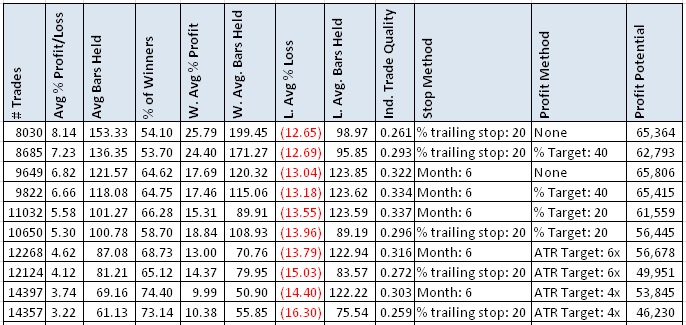
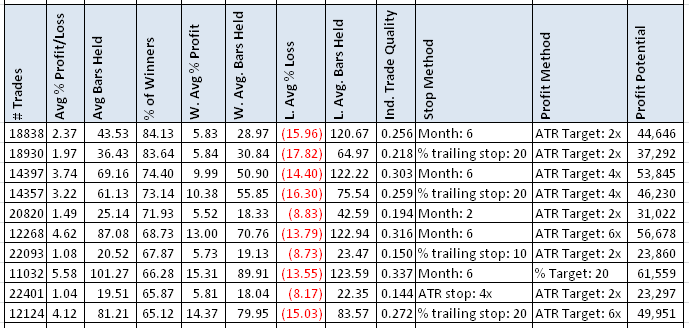
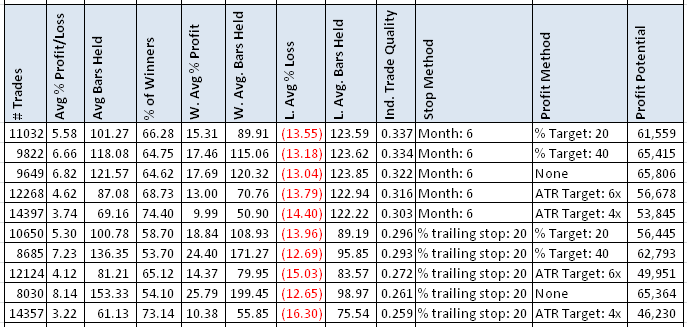
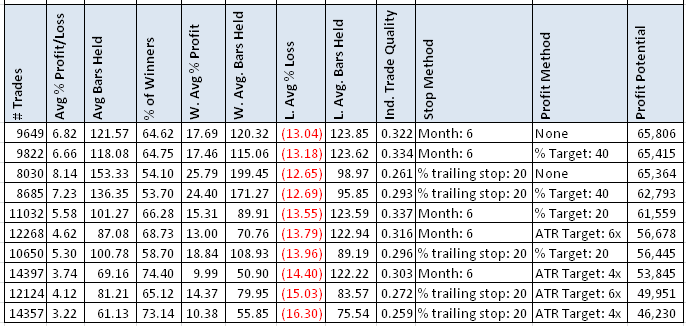
The results from these tests do not point at one best method. It all depends on what metric one is focusing on. Each table sorts the 36 runs by one of the metrics and shows the top 10 results. ‘Profit Potential’ is ‘Avg % Profit/Loss’ times ‘# Trades.’
Avg % Profit/Loss
With the top ‘Avg % Profit/Loss’ of 8.14% this looks tempting. But the average hold is 7 months. The general theme of the top results is large stops and large targets.
% Winners
When I first saw the 84% correct, I thought something was wrong. But after checking, I realized the average loss is about 3 times the average winner. The stops are all overall the place but the targets all tend to be small. I will remember this for further testing.
Individual Trade Quality (ITQ)
For high ITQ, the 6 month stop is the ticket. But the targets are all over the place.
Profit Potential
‘Profit Potential,’ ‘Avg % Profit/Loss’ times ‘# Trades,’ has large stops but the targets all over the place.
Spreadsheet
If you’re interested in a spreadsheet of the data used to generate these tables, enter your information below, and I will send you a link to the spreadsheet. The spreadsheet includes more variations.
Final Thoughts
Next steps for this is find a ranking method to place the trades in a portfolio. This will be the hard part. I have seen systems go from being lousy to great because of the ranking method. My strong experience with shorter trading systems will not likely be of help here and I will have to think of different ways to rank the stocks. If you have any ideas, add them to the comments.
Backtesting platform used: AmiBroker. Data provider:Norgate Data (referral link)


