- in General by Cesar Alvarez
Making new equity highs. It happens less than you think.
A reader sent me a link to presentation, Robert Frey – 180 years of Market Drawdowns, about drawdowns and the time that a strategy is underwater. I highly suggest you watch it. I wanted to perform my own analysis on how often a buy and hold strategy on the S&P500 index is making new equity highs. Then, I wanted to compare the results to a new strategy I am working on for my trading. From previous experience, this number is a lot lower than people expect.
Percent Trading Days Making New Equity Highs
A trading strategy is at a previous equity high, a new equity high or in a drawdown. Our metric will be % trading days making new equity highs, % NEH. This is the number of days that the equity is at a new equity high divided by the number of days in our test. Assuming zero percent interest on cash, if a strategy makes a new high and then goes to all cash, only the day it made the new high is counted. Although the all the cash days are the same value as the initial high, they are not higher values. Perhaps one should count these days but I think it gives an unfair advantage to strategies that are in cash a lot. I am using daily bars for this metric but can also use weekly or monthly bars. As traders, we look at our equity daily and therefore we will focus on that.
S&P500 Total Return
First will start with a simple buy and hold example. I will use two start dates. The first 1/4/1988 is when I have the start of the SPX total return data. The second will be from 1/1/2007 which is the start of my new strategy.
$SPXTR Results

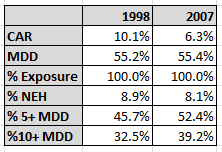
Since 1998, the index is only making new highs 8.9% of the time. I don’t know about you, but I found this number a lot smaller than I expected given that the CAR is 10.1%. I also added “%5+ MDD” which is the percentage of days that the index is in a 5% or more drawdown. I also found these numbers larger than expected. A lot of traders worry at 10% drawdowns and one is there one-third of the time. The numbers don’t change that much when starting from 2007.
Simple Mean Reversion
One is probably thinking, “I am not doing buy and hold.” Next we will look at a very simple mean reversion strategy. Since the numbers are similar from the 1998 and 2007 start dates, we will focus on 2007 only. Entry and exit is on the close.
Buy: RSI2 <30
Sell: RSI2 > 70

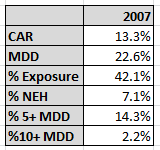
This simple strategy doubles the CAR and halved the maximum drawdown! The time in with a 5%+ or 10%+ drawdown has gone down dramatically. But even with these big improvements, the % NEH has gone down!
Another Strategy
Now you may thinking, what about a better strategy. Here are numbers for a strategy I am working on for my own trading. The drawdown is larger than I want but this is a good example.

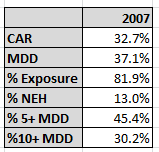
This strategy has a CAR of 32% but still is only making new equity highs 13% of the time. And again you are in more than a 10% drawdown almost one-third of the time. These numbers can be hard to deal with if you don’t know ahead of time what you are getting into.
Spreadsheet & AmiBroker Code
Fill the form below to get the spreadsheet with the data (including $SPXTR) and formulas used to generate these stats. You can fill in your equity curve data to see what values your strategy produces. As an extra bonus for AmiBroker users, I have also included the AFL to calculate “% NEH” and “%10+ MDD.”
Final Thoughts
Since trading involves psychology, knowing how often you are underwater can prepare one for when they keep happening. Knowing how often you are in a large drawdown is important because this is when most traders toss out a good strategy. Maybe 10% drawdown is not your number but know at what percent drawdown you start worry and see how long your strategy stays there.
Backtesting platform used: AmiBroker. Data provider:Norgate Data (referral link)
Good Quant Trading,

Fill in for free spreadsheet and AmiBroker code:
![]()

