- in Mean Reversion , Research , Stocks by Cesar Alvarez
Mean Reversion and the Broken Rubber Band
A common way to describe a mean reversion trade is a rubber band that stretches away and then snaps back. Something that Steve, my trading buddy, and I discuss when a trade keeps going against us is that the rubber band has broken. I have never tested that concept. Meaning after N day sell-off, are we now more likely to continue to sell off than bounce? Doing research is not always about trying to develop a new strategy but sometimes it is testing a concept. The concept may lead to a new trading idea.
The Test
Date range is from 1/1/2006 to 3/31/2016. Buy/short all stocks that meet the condition. No commission or slippage.
Setup
- Stock is member of S&P500
- Close greater than $1
- The 21 day moving average of Close times Volume is greater than one million
- Stock has closed under the 5 day moving average for exactly (10,11,12,…,19,20) days
- Short at the next open
Exit
- Cover the position at the open after (5,10,15,20,25,30) days
Since I want to see if the rubber band has broken, I am shorting the positions.
Results – S&P500 from 2006
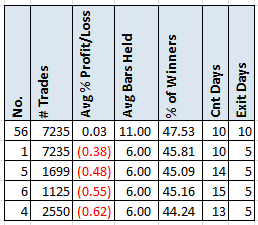
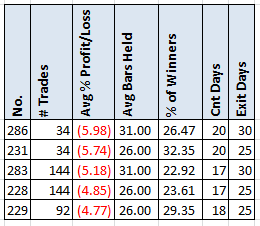
Shown here are the top five results out of 66 variations. Only one made money. Clearly the rubber band does is not breaking. Looking at the worst 5.
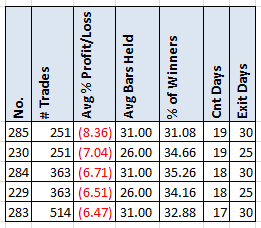
We can see that we get some big bounces after these long sell offs. But I had to questions. One, what about less liquid stocks? Two, does this pattern still hold the last few years?
Results – Russell 3000 from 2006
For this test, I want the stock to be a member of the Russell 3000.
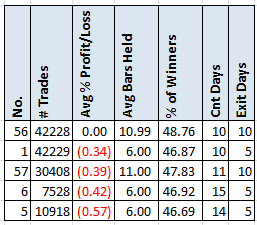
These are the five best results. No real change in the results. If one looks at the five worst results one still see a strong mean reversion. You can see this in the spreadsheet.
Results – S&P500 from 2013
Is this pattern still holding over the last three years?
Here are the top results.
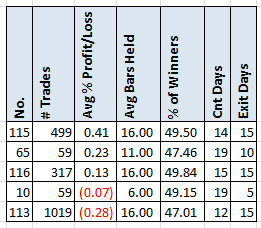
We have a few more broken rubber bands variations but the same pattern is still holding. Looking at the worst five results we see the same thing.
Rubber bands don’t seem to break when a stock sells off. What about when they go ballistic?
Buying Strength
Setup
- Stock is member of S&P500
- Close greater than $1
- The 21 day moving average of Close times Volume is greater than one million
- Stock has closed over the 5 day moving average for exactly (10,11,12,…,19,20) days
- Buy at the next open
Exit
- Sell the position at the open after (5,10,15,20,25,30) days
Results – S&P500 from 2006
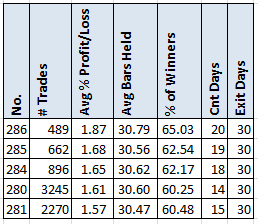
Here are the best five variations and this is interesting. We are not seeing mean reversion to losing trades. But are these any better than the average 30 day hold on all stocks? The answer is barely with the average 30 day return of all stocks being 1.53%. Not a big enough edge to trade on the long side.
Spreadsheet
Fill the form below to get the spreadsheet with lots of more information. See data on the other holds and breakdown by years. Lots of great information here.
Final Thoughts
When a stock is under the 5 period moving average for a long time, we saw a strong tendency to bounce back up. No broken rubber bands there. But when a stock is over the MA5 for a long time, we saw some small evidence of a rubber band about to break. But not enough to trade. Normally I would have taken this as a sign to get out, but the tests don’t suggest that.
Backtesting platform used: AmiBroker. Data provider:Norgate Data (referral link)
Good Quant Trading,

Fill in for free spreadsheet:
![]()

