- in Mean Reversion , Research , Stocks by Cesar Alvarez
Mean Reversion Check Up 2022
A common question I get is whether mean reversion is still working. My response is I am still trading a mean reversion strategy but the edges seem to get smaller. Over the year I have investigated this. I was asked again recently and wanted to investigate again. Here are the results of my 2022 investigation.
The Rules
Test date range 1/1/2000 to 9/30/2022. I wanted to keep the rules simple. I tested various ways with the 200-day moving average. The reason for this is that some people only trade stocks above the 200, while I like to trade without. In general, this will have more volatility but better returns.
Buy Rules
- Stock is a member of the Russell 3000
- 2-period RSI is less than 1
- Close is greater than $3
- 21-day moving average of Close*Volume is greater than $1 million
- [Stock is above 200-day moving average, the stock is below 200-day-moving average, NA]
- Enter on next open
Sell
- 2-period RSI is greater than 70
The spreadsheet you can get also has results for the S&P500 stocks.
Results for Above the 200-day Moving Average
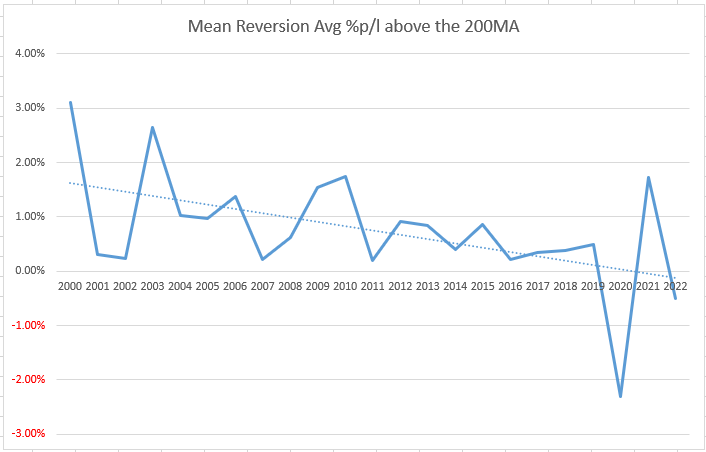
Average %p/l
Two things I found interesting. In the current bear market and the one in 2020, the returns are negative. Returns for 2000, 2002, 2008 and 2011 bear markets were all positive. As we can see the edge is getting smaller.
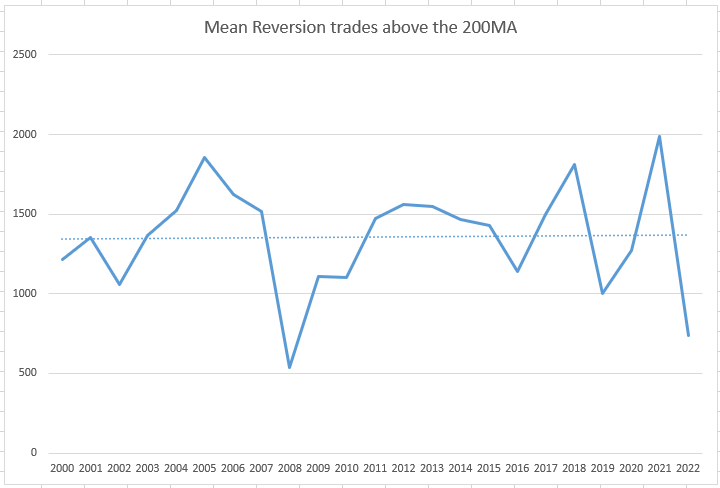
Number of Trades
Here we can see the number of trades fluctuated but basically stayed flat. As expected, bear markets have fewer trades.
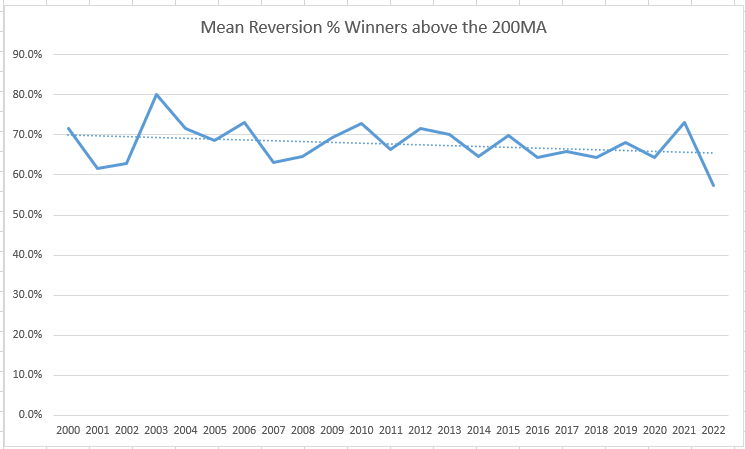
% Winners
This trend is also flat. What is interesting this year is the worst for % winners.
Results for Using No 200-day Moving Average
For my mean reversion strategy, I do not use a 200-day moving average.
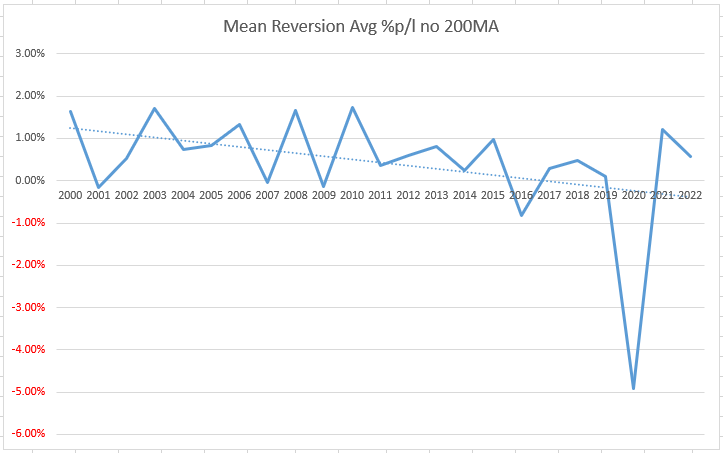
Average %p/l
This agrees with my personal trading. Edges getting smaller. The 2020 bear market sucked and but this current one has been OK.
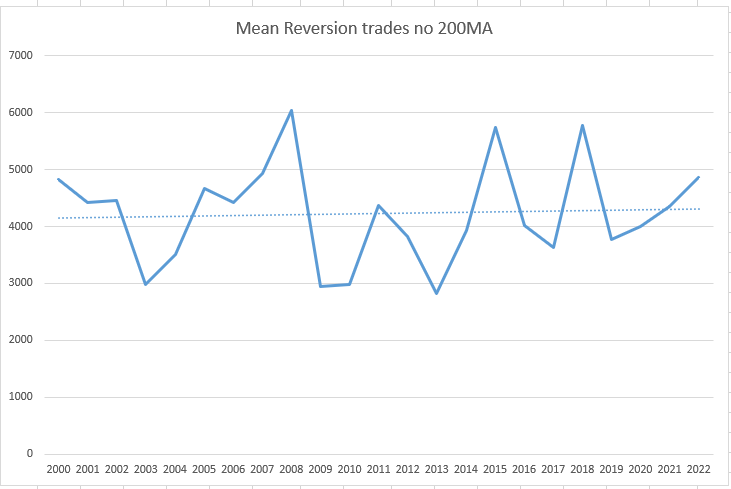
Number of Trades
Trade count is staying flat per year.
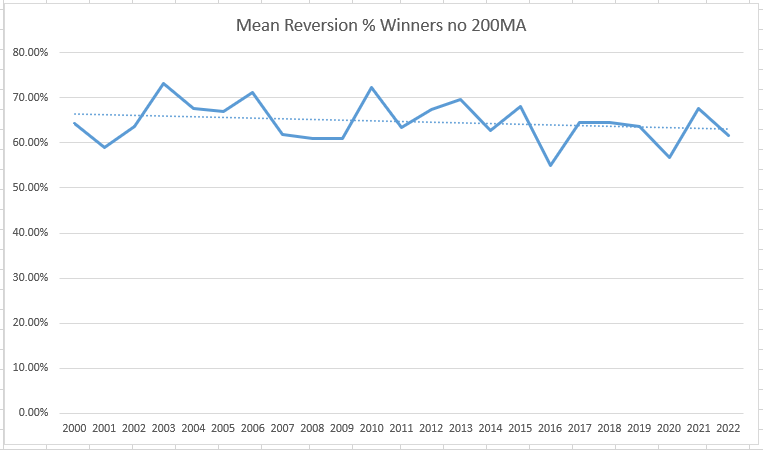
% Winners
And % winners are also staying most flat too.
Spreadsheet
Fill in the form below to get the spreadsheet with lots more information. Included are results for those below the 200-day moving average and on the S&P500 stocks.
Final Thoughts
These tests confirmed what I see in my trading, that the edges are continuing to get smaller but are still there. The % winners and # of trades are staying about flat.
Will we get to where the edges make it not worth the work? I don’t know.
Backtesting platform used: AmiBroker. Data provider: Norgate Data (referral link)
Good quant trading,

Fill in for free spreadsheet:
![]()

