- in Rotation , Stocks by Cesar Alvarez
Monthly S&P500 Stock Rotation Strategy
From the “Should You Buy the Best or Worst YTD Stocks” post, several readers made comments if one could make a monthly rotation system from this idea. From that post, buying either the strongest or weakest stocks out-performed the SPX with the weakest giving the best results. Will that be the case again?
Test Parameters
- From 1/1/2001 to 10/31/2013
- $.01/share for commission
- 3 month T-bill interest rate used for cash
Best N Month Rules
- It is the first trading day of the month
- Stock is a member of the S&P500
- Rank stocks from the highest to lowest by (6,12) month return
- Buy the top 20 ranked stocks at the close
- Optional market timing rule: SPX close > 200 day moving average of SPX closes on the entry day
- Hold until next month
Worst N Month Rules
- It is the first trading day of the month
- Stock is a member of the S&P500
- Rank stocks from the lowest to highest by (6,12) month return
- Buy the top 20 ranked stocks at the close
- Optional market timing rule: SPX close > 200 day moving average of SPX closes on the entry day
- Hold until next month
Results
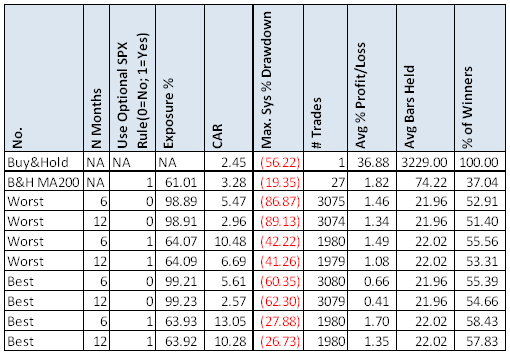
The concept has possibilities as a trading strategy. What jumps out is that both the worst and best variations outperform the Buy and Hold variations. The scary stat is the horrendous drawdowns. I can’t believe that one of the variations had an 89% drawdown but still outperforms Buy and Hold. Not a strategy I would trade but something that has lot more potential than I expected.
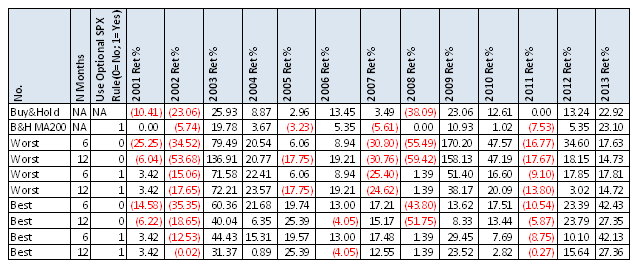
Looking at the yearly returns:
Some years it is better to buy weakness and some years, as this year is, it is better to buy strength.
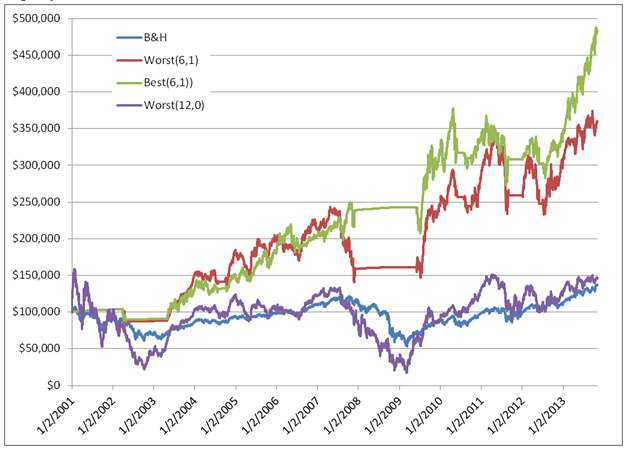
Equity Curves
- B&H = Buy & Hold
- Worst(6,1) = Worst 6 month return ranking. Using the market timing rule
- Best(6,1) = Best 6 month return ranking. Using the market timing rule
- Worst(12, 0 ) = Worst 12 month return ranking. No market timing rule
Spreadsheet
If you’re interested in a spreadsheet of my testing results, enter your information below, and I will send you a link to the spreadsheet. Along with the above results the spreadsheet includes buy the 10 & 50 stocks each month and look backs of 3 and 9 months.
Backtesting platform used: AmiBroker. Data provider:Norgate Data (referral link)


