- in ETFs , Rotation by Cesar Alvarez
Percent S&P500 Stocks Trading Above MA50 as Market Timing Indicator
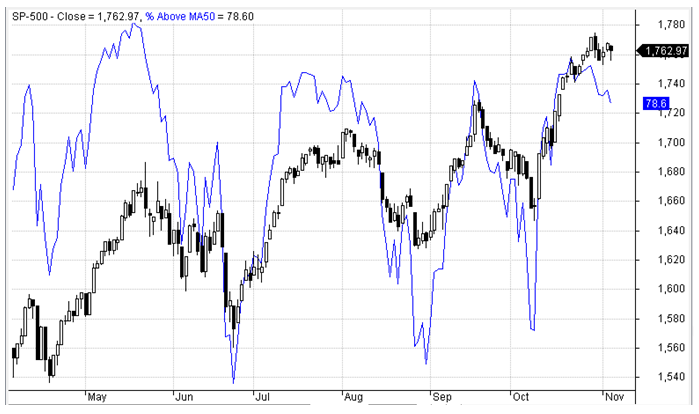
Does the percent of S&P500 stocks trading above their 50 day moving average predict future market returns? Over the last several weeks, I have seen several charts of the percent of S&P500 stocks trading above their 50 (or 200) day moving average overlaid on the S&P500. From these charts, it appears one could build a market timing indicator. The concept really looks like it has promise.
Chart from April to November 2013.
The Tests
Dates: 1/1/2001 to 10/31/2013.
PercentAbove50 = 100*((# of S&P 500 stocks trading above their 50 day SMA)/500)
Above Indicator Test
Both the Buy and Sell Rules use the same cut off value.
Buy Rules
- On the last day of the trading week
- PercentAbove50 > (10,20,30,40,50,60,70,80,90)
- Buy SPX at the close
Sell Rules
- On the last day of the trading week
- PercentAbove50 < (10,20,30,40,50,60,70,80,90)
- Sell SPX at the close
Below Indicator Test
Both the Buy and Sell Rules use the same cut off value.
Buy Rules
- On the last day of the trading week
- PercentAbove50 < (10,20,30,40,50,60,70,80,90)
- Buy SPX at the close
Sell Rules
- On the last day of the trading week
- PercentAbove50 > (10,20,30,40,50,60,70,80,90)
- Sell SPX at the close
Baseline Test
This is a simple market timing rule that produces good results.
Buy Rules
- On the last day of the trading week
- SP-500 Close > 200 day moving average
- Buy SPX at the close
Sell Rules
- On the last day of the trading week
- SP-500 Close < 200 day moving average
- Sell SPX at the close
The Results
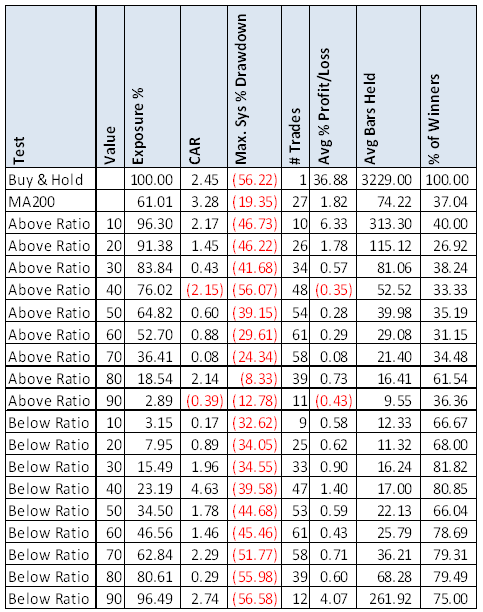
Using the MA200 market timing greatly reduces the maximum drawdown while increasing the Compounded Annual Return. Mostly it does not look like this indicator can be a market timing tool. ‘Above 90’ seems to indicate the market is ready for a down turn.
Besides the above tests, I applied moving averages to PercentAbove50 and moving average crossovers with similar to worse results. Send me any ideas you want tested on this indicator.
Again, this reminds us what looks good in a chart may not test out. That is why I do these tests and share results even if they that don’t work out.
Backtesting platform used: AmiBroker. Data provider:Norgate Data (referral link)
Spreadsheet
If you’re interested in a spreadsheet of my testing results, enter your information below, and I will send you a link to the spreadsheet. Included is a year by year breakdown of the returns. The raw data of the number of S&P500 stocks trading above their MA50 is also in the spreadsheet.


