- in Mean Reversion , Research , Trend Following by Cesar Alvarez
Relative Strength Index (RSI) Analysis
Recently I have been researching longer term hold strategies. I wondered which indicators by themselves would show an edge 3 to 6 months out. I am not looking to create a strategy from the indicator alone but want to know is there a statistical edge with it. Naturally, I started with my favorite Relative Strength Index, RSI.
Rules
Test period is from 1/1/2006 to 12/31/2015. Rules in parenthesis are tested individually. There is no commission or slippage.
RSI Rule
The RSI rule is true on a cross of the value. If the RSI rule is ‘RSI2 < 5’ then this is true only on the day the two period RSI crosses from above 5 to below 5. These are the RSI rules tested:
- RSI2 < .5
- RSI2 < 1
- RSI2 > 99
- RSI2 > 99.5
- RSI8 < 15
- RSI8 < 20
- RSI8 > 80
- RSI8 > 85
- RSI14 < 25
- RSI14 < 30
- RSI14 > 70
- RSI14 > 75
- RSI20 < 30
- RSI20 < 35
- RSI20 > 65
- RSI20 > 70
Buy
- Stock is member of the S&P 500 index
- Stock Close is above $5
- The 21 day moving average of Close time Volume is greater than $1 million
- MA200 rule: (Close above MA200, Close below MA200, not used)
- SPX MA200 rule: (SPX close above MA200, SPX close below MA200, not used)
- RSI rule is true
- Enter the next day at the open
Sell
- Exit (5, 10, 21, 63, 126) days later on the open
Multiple Entries
This is important. We allow multiple entries in a stock if the Buy rule happens again. For example, the Buy rule is ‘RSI2 < 5’ and the exit rule is 126 days. If the stock’s RSI2 crosses under 5 today, we enter. Now if it crosses again below 5 a month later we enter again. Each position is exited 126 day after entry and counted a separate trade.
The Baseline
All values in the tables that follow are for closed trades only. The baseline results in the tables below use the same rules as above but remove the RSI rule. This allows us to compare how the RSI rule changes the results.
P-value
We will be comparing the ‘average % profit/loss’ of the test vs the ‘average % profit/loss’ on the baseline, which is the population of all possible trades. To narrow down the results, I calculated the p-value for each test. Some may argue if this is the right metric or have other issues. I am trying to use this help point me to interesting results. I am not saying that a p-value below 5% (or 1% or whatever value you prefer) means that the results are good. Do I want a lower value, yes, but I do not have a hard cut off. They are shades for grey.
For more information on the issues and interpretation of p-values, you can read the following:
- ASA statement on p-values
- We’re using a common statistical test all wrong. Statisticians want to fix that.
- An unhealthy obsession with p-values is ruining science
% Profit/Loss Results
Now given what I just said, I will use a cutoff of 5% for the p-value to narrow down results to show. There are 720 variations and 443 of those have p-values under 5%.
RSI2 & 5 Day Hold

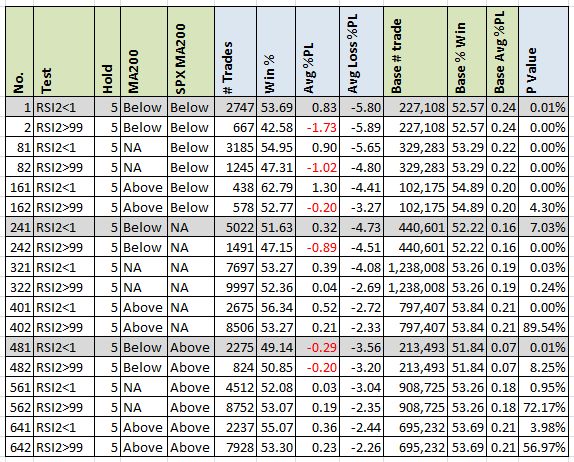
First I wanted to see the results for RSI(2) at a 5 day hold. We notice that most look good and as expected. Notice run 241 with a p-value of 7.03%. One may think this run has no edge. But the run does not use the SPX under the MA200 filter. If we look at the other two highlighted runs what use the filter, we see very low p-values. What is going on? Since the edges are in opposite directions, they cancel themselves out when we don’t use the SPX filter. This is why one cannot blindly look at p-values. Another issue that may be hidden by the data is 2008 results. Are all the good results coming from 2008?
63 Day Hold
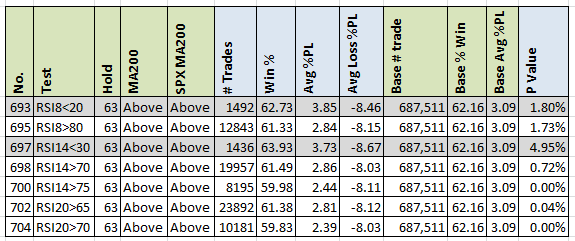
What I was looking for was there an edge to the long side at the 63 day hold when both the stock and index are above the 200 day moving average.

Only two results have p-values under 5% with an edge greater than the baseline. Before we jump up and down, we should notice that the edge is not that much bigger than the baseline. The main driver for that low p-value is the number of trades. If the number of trades on run 693 was halved the p-value would jump to 10%. This is why one should not just focus on p-value. But it gives us an area to look at. There appears to be a small edge that may get bigger with the right additional filters.
ATR Multiple Results
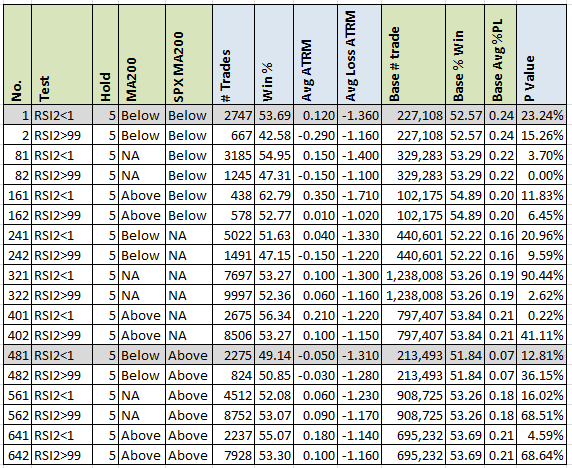
Perhaps using ‘average % profit/loss’ is not the right parameter because it does not take into account a stock’s volatility. Which I can I understand. I computed the average return over N days as a factor the 10 day ATR on the signal day. Sometimes this gave very different results than using ‘average % profit/loss.’ It is up to you to decide which one you want to focus on.
RSI2 & 5 Day Hold

The two highlighted rows are the same as the first table on this post. The p-value took a large jump up. Does this mean that using RSI2<1 does not work? Depends on how you measure and trade it.
Spreadsheet
Fill the form below to get the spreadsheet with lots of more information. See data on the other holds and other RSI values. Lots of great information here.
Survey
Did you like this analysis and want to see it on other indicators? Fill in the survey. Indicate what indicator you want next. Survey closes on May 4, 2016.
As to the previous post’s poll, it was a clear winner to keep showing the research. Lots of great comments too.
- ConnorsRSI was the winner with 27% of the votes
- ADX 25%
- MACD 23%
The next post in the series will be on ConnorsRSI. That should be an interesting one since I created that for a short-term indicator. Can I find parameters that make it work on longer holds?
Intermediate AmiBroker 201 Course is now available
I have completed my new Intermediate AmiBroker 201 Course. If you are looking to expand your knowledge of backtesting and AmiBroker, this course is for you. Click here to learn more. Topics covered include:
- Optimization: basic and smart
- Project files
- Custom chart indicators
- Multiple timeframes
- Custom backtest reports
- High level Custom Backtester (CBT)
- Scaling in and out of positions
Final Thoughts
This was an interesting exercise for me. It was interesting to see how changing how I measured performance could drastically change whether I thought something had an edge or not. Although some edges were statistically significant, the edge compared to the base was not that large and not as interesting. I am working on doing this with ConnorsRSI.
Backtesting platform used: AmiBroker. Data provider:Norgate Data (referral link)
Good Quant Trading,

Fill in for free spreadsheet:
![]()

