- in ETFs , Market Timing by Cesar Alvarez
Sell in August and Go Away
I was going through some old issues of Technical Analysis of Stocks & Commodities looking for some ideas to test. In the November 2019 issue, I came across “Stock Market Seasonality: A Global Phenomenon” by Jay Kaeppel. The basic idea was that global markets share the same “buy in November and sell in May” phenomenon as the US market.
This got me thinking about how markets have changed since 2012 or so. My theory is that before 2012, this pattern was better than either buy and hold or other start and end months. But after this time, buy and hold or longer hold dates would be better. The reason is that the Fed is involved in the market more and keeping bear markets much shorter.
Rules
Buy on the last day of month X at the close. Hold for Y months and sell at the close on the last day of the month.
For the classic seasonal test, buy in November and sell in May, the values would be 10 for X and 6 for Y. This would mean buy at the close on the last day of October and then sell on the last day of April.
For values of X, I tested 1 to 12. For values of Y, I tested 3, 6, 9. In the downloadable spreadsheet, you can find results for Y values of 1-11.
Universe of ETFS: EWA, EWC, EWD, EWG, EWH, EWI, EWJ, EWK, EWL, EWM, EWN, EWO, EWP, EWQ, EWS, EWU, EWW, SPY.
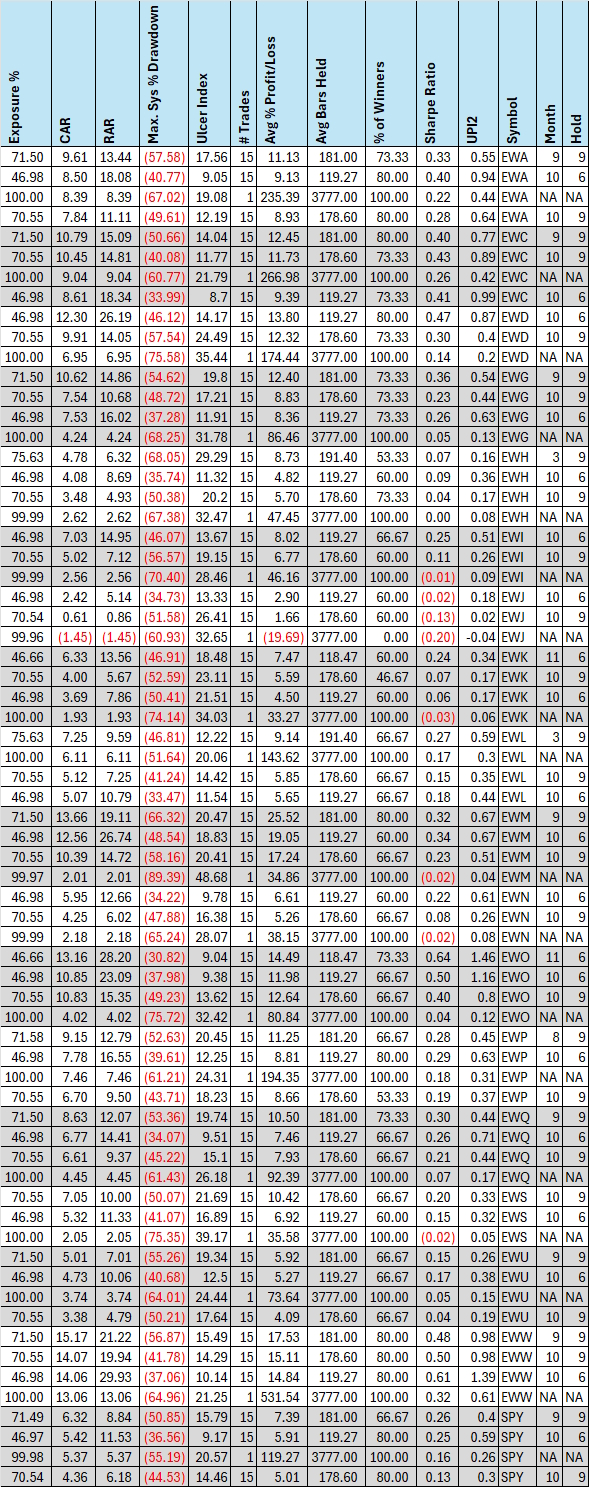
1997-2011 Results
For each country ETF, I am showing:
- Buy at the end of October and sell at the end of April. My theory was this would be the best most of the time.
- Buy at the end of October and sell at the end of July. My longer hold hypothesis.
- Buy and Hold
- The best combination of entry month and hold length. This was more out of curiosity.
It is possible that the last item is one of the first three, so there will be only three rows of that country’s ETF.
For each of the given ETFs, I counted which of the following was the best
- Buy at the end of October and sell at the end of April: 13 times
- Buy at the end of October and sell at the end of July: 4 times
- Buy and Hold: 1 time
Not surprisingly, buying at the end of October and selling at the end of April was the best combination most of the time. This is expected. This also tells me that these ETFs are all highly correlated if most are doing the best during the same period.
It’s also interesting that in 13 instances the best combination was not one of the first three.
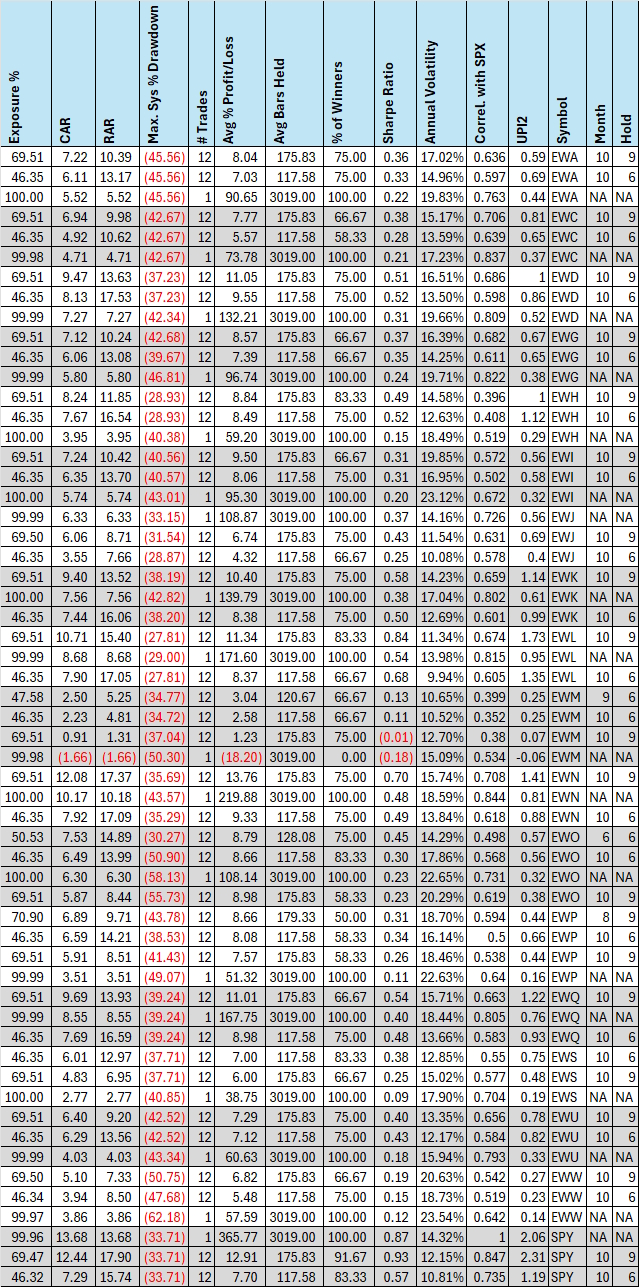
2012-2023 Results
For each country ETF, I am showing:
- Buy at the end of October and sell at the end of April. My theory was this would not be best most of the time.
- Buy at the end of October and sell at the end of July.
- Buy and Hold
- The best combination of entry month and hold length. This was more for curiosity.
For each of the given ETFs, I counted which of the following was the best
- Buy at the end of October and sell at the end of April: 4 times
- Buy at the end of October and sell at the end of July: 12 times
- Buy and Hold: 2 times
Wow, what a big change! Now buying at the end of October and selling at the end of July is clearly the best.
In 3 instances, the best combination was not one of the first three. This is a dramatic drop from the 13 times that this occurred for the 1997 to 2011 period.
Spreadsheet
Fill in the form below to get the spreadsheet with lots of additional information. See the results of all variations from the optimization run. This includes top drawdowns, trade statistics and more.
Final Thoughts
From these seasonality tests, it appears that markets have changed since 2012, and the old adage to “sell in May and go away” may no longer be good advice. The new adage should be “sell in August and go away.”
Perhaps the longer holds are doing better now because bear markets since 2012 are shorter. Although that’s my current thinking, I will probably do a post confirming it. My theory is that shorter bear markets are due to the actions of the Fed. And I don’t see them changing their behavior anytime soon.
Blog post title side note. I had wanted to find a word that rhymed with August. I asked ChatGPT and Gemini for words that rhymed with August that mean ‘go away.’ But none could be found that I liked.
Backtesting platform used: AmiBroker. Data provider: Norgate Data (referral link)
Good quant trading,

Fill in for free spreadsheet:
![]()


