- in Research by Cesar Alvarez
Should one trade high or low volatility stocks?
If one is trying to develop a multi-month hold stock strategy, is it better to focus on high or low volatility stocks? For a long time, I have wanted to add a longer term stock strategy to my basket of strategies that I trade. I do not expect this strategy to perform as well as my shorter term strategies but work as a complement to them
Low volatility or high volatility? Short term trading strategies tend to do best when they focus on high volatility stocks. Will this be true for a longer hold strategy?
The test
We will start with a basic test. In future posts, we will expand and refine on the rules. Date range from 1/1/2004 to 12/31/2013.
Buy Rules
- Stock has 21 day moving average dollar-volume greater than (10,20) million over the last 3 months
- Close is greater than $5
- Six month return is greater than 10%
- Close is greater than the 200 day moving average
- The SPX close is above the 200 day moving average
- The stock’s 100 day historical volatility(HV100) is between (20,30) (30,45)(45+) for the last 5 five days
Sell Rules
- 15% trailing stop evaluate at the close
Buy rules 1 & 2 are liquidity rules. Rules 3 &4 are a simple way to determine that the stock is an uptrend. Rule 5 is our market timing rule. Since we are trading longer term, we want the market wind at our back. Rule 6 is what we want to know. These ranges were picked to give approximately the same amount of trades in each bucket.
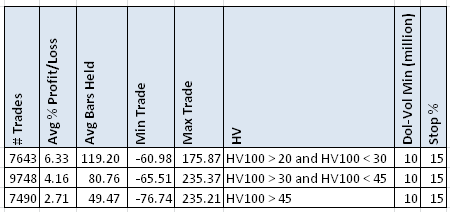
$10,000,000 Dollar-Volume Results
Several stats jump out. First the average % p/l is significantly better for the lower HV100 stocks. Lower volatility stocks also have a much higher % winners. The one down side is they have a much higher holding period.
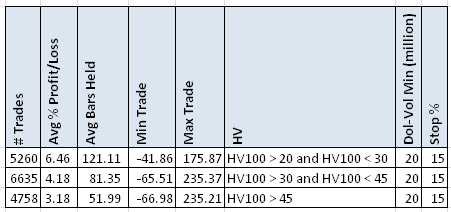
$20,000,000 Dollar-Volume Results
How do these results hold for higher dollar-volume stocks?
The same pattern holds. What is surprising is the higher dollar-volume stocks in the bottom HV100 bucket have a higher avg %p/l. Not what I expected.
Spreadsheet
If you’re interested in a spreadsheet of the data used to generate these tables, enter your information below, and I will send you a link to the spreadsheet. The spreadsheet includes yearly breakdown with more variations.
Additional Notes on Testing
These tests were done using Norgate Data. I am evaluating their data as a possible replacement to my current data provider, CSI Data. The reason for this is they integrate much better with AmiBroker and they have historical index constituent data.
Conclusions and Next Steps
These first tests point to trading lower volatility stocks and those with higher dollar-volume. Next steps is testing for a better exit. Some current thoughts are using an ATR stop and using profit targets.
Backtesting platform used: AmiBroker. Data provider:Norgate Data (referral link)


