- in Mean Reversion , Stocks by Cesar Alvarez
Simple ConnorsRSI Strategy on S&P500 Stocks
A frequently asked question is how I pick which variation from an optimization run to trade. This post will cover a ConnorsRSI strategy on S&P500 stocks. We will use a wide range of parameters to give us lots of choices to be used in the next post. In that next post, I will show how I take the results and narrow them down to one potential variation to trade. And then the final post, I will cover parameter sensitivity to help determine if the results are likely overfitted or not.
3/27/2017 CORRECTION: When I originally posted this, the results shown in the tables were not for the rules shown below. The table results are now matching the rules as below. The spreadsheet also has the corrected results.
The Strategy
Test range from 1/1/2007 to 12/31/2016. Any mention of ConnorsRSI is using the default parameters of (3,2,100).
Set up Rules
- Stock is member of the S&P 500 index
- It has been less than (10,15,20,25,30) days since a 39 week high
- ConnorsRSI is less than (10 to 40 in steps of 2.5)
Rule (A) gives us a good trading universe.
Rule (B) is looking for a stock with recent strength. Why 39 weeks? Originally I was trying to decide between 26 weeks and 52 weeks. I decided to split the difference.
Rule (C) is our sell off rule. Nothing fancy but I wanted to test a large range of values
Entry Rules
- If we have a set up, then enter a limit order for the next day at (.5, 1.0, 1.5, 2.0)% below the close. Order good for one day only.
- Only place enough orders so if they are all filled you are not in more than 7 positions
- If have multiple set ups, then rank from high to low by the 100 day historical volatility.
We enter on additional intraday weakness.
Exit Rules
- ConnorsRSI is greater than (50, 55, 65, 70)
- Exit on next open
Simple mean reversion exit of waiting for the bounce. No stops. You may have also noticed there is no market timing rule. Will this get killed in 2008?
My Goals
When developing a strategy, I have metrics I am looking to beat. For an S&P500 strategy, I am looking for CAGR greater than 20% and a max drawdown less than 25%. I like these metrics because they are simple to understand and at the end of the day they are what I care about. You must decide what metrics and values you are looking for. The spreadsheet will have the full run results so you can filter it to look for what you like.
Results – Highest CAR
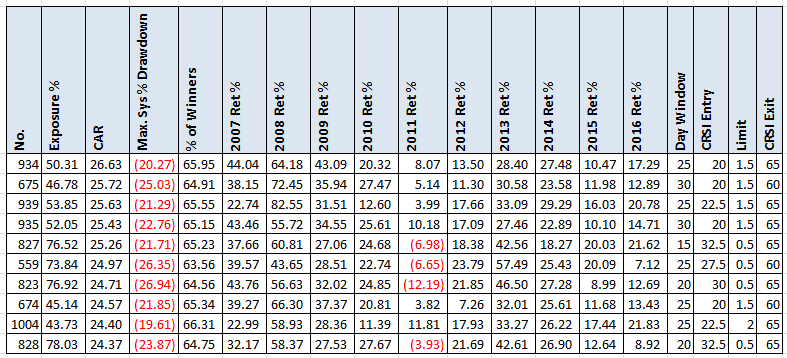
We have 1300 variations and here we have the top ten results sorted by CAR. We can see there are already several variations that satisfy my goals. I am surprised to see how well these variations did in 2008 and 2011. Even last year had good results. Sometimes simple is good. But I pick none of these top ones to trade. These likely got more lucky than other variations. These are also more likely to be on a parameter peak which I will explain in the future post.
Results – Lowest CAR
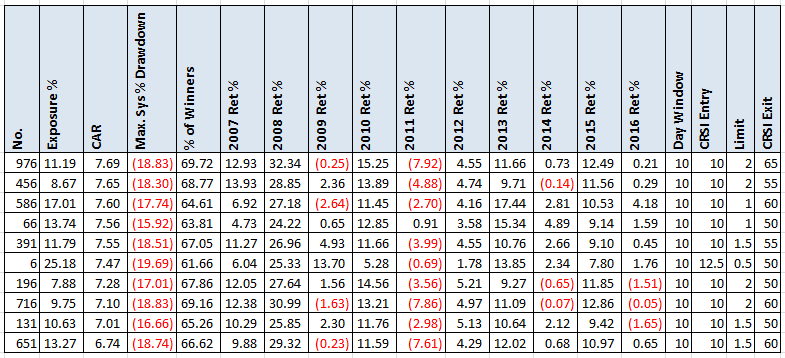
Looking at the lowest CAR, we can see single digit CAR but notice that the exposure is also very low.
Potential Future Tests
There are lots of other tests you can do to improve the results
- Try different N-week high. Especially 26 & 52 week since those are common values
- Try the limit entry to take a stock’s volatility into account
- Add a minimum volatility for a stock to be a setup
- Add that today’s close is under X% of the day’s range
- Try a different ranking method
Spreadsheet
File the form below to get the spreadsheet with lots of additional information. See the results of all variations from the optimization run. This includes top drawdowns, trade statistics and more.
Final Thoughts
Even though I created ConnorsRSI, I am still surprised on how well it can work. Just a couple of rules have produced good numbers for trading the S&P500. In the next post, I will show how I go about taking those 1300 variations to the one I would consider trading.
Backtesting platform used: AmiBroker. Data provider:Norgate Data (referral link)
4/12/2017: Read the follow up posts, ConnorsRSI Strategy: Optimization Selection and ConnorsRSI Strategy: Sensitivity Analysis.
2/14/2018: Read Trading the Equity Curve on this strategy
Good quant trading,

Fill in for free spreadsheet:
![]()


