- in Research by Cesar Alvarez
SPX breaks record of closing above five day moving average
How strong is this market? The SP-500 index had closed above its five day moving average for 29 days and on Friday it finally closed below it. The last day it closed under the five day moving average was on October 16, 2014. This is the longest streak since 1963 (that is as far back as my data goes). The old record was 26 days in 1986. The previous best streak in the last decade was 19, which has been crushed. The index has not had a short-term pullback in the last month which is tough for a short-term mean reversion trader.
The question that always follows is what happens when the streak is broken. We will see what happens if one enters at the close the day the streak is broken and then exit 5 days, 1 month, 3 months and 6 months later.
Why am I using the five day moving average? From years of research, this has been a good indicator use to measure short term mean reversion.
The baseline
First we need to know what the market does normally. Here we look at buying every day and then using one of the exits.
Results from 1963
Results from 2005
An interesting side note is that all the returns in the last decade are down.
Streaks of close above 5 day moving average
These are the average returns for streaks greater than or equal to 10 days.
Results from 1963
Results from 2005
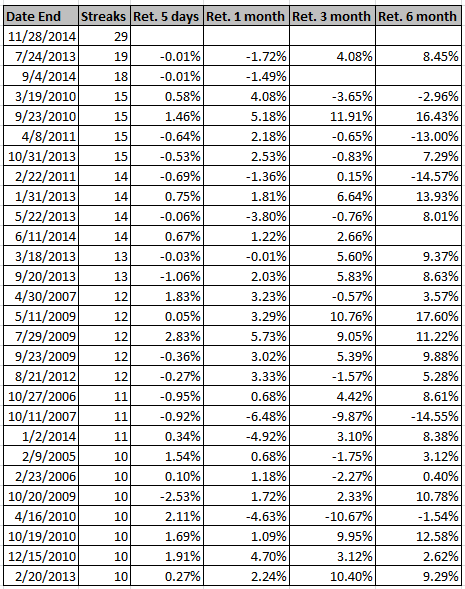
All the streaks of 10 or more since 2005
Observations
On average the end of the streak does not signal future weakness but strength in all timeframes. What really stands out is that future volatility is greatly reduced. Anyone calling for a large correction in the next 3-6 months has the odds stacked against them.
Backtesting platform used: AmiBroker. Data provider:Norgate Data (referral link)
Good Quant trading,

Get the spreadsheet
Fill in the form to receive a link to the spreadsheet with all the data used to generate these tables. Streaks from 1963 are included.


