- in Research by Cesar Alvarez
Stop Losses and Equity Curves
This extended research is from two readers’ requests. Request one is adding stop losses on the “Monthly S&P500 Stock Rotation Strategy.” Request two is seeing the equity curves from “Percent S&P500 Stocks Trading Above MA50 as Market Timing Indicator.”
Stop Losses
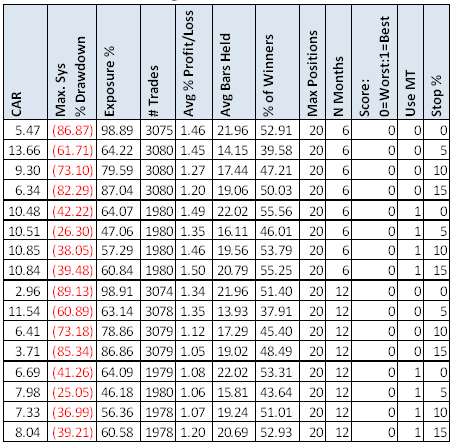
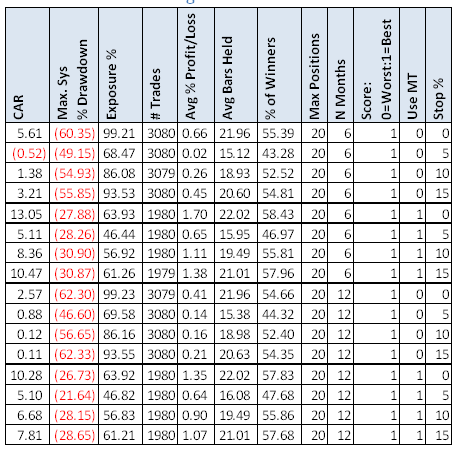
Continuing from the post, we are adding a maximum stop loss. The stop is evaluated at the close each day with the exit happening at the close. The tested stops are 5%, 10% and 15%.
Worst N-Month Ranking
Using the Worst N month ranking, we can see that the stops help either by raising CAR and lowering MDD. Normally close stops tend to be the worst but the 5% stop tends to be the best. Normally stops hurt mean reversion strategies. The longer hold periods may be the reason they help in this case.
Best N-Month Ranking
For the best N-month ranking, stops appear to hurt the all results.
Equity Curves
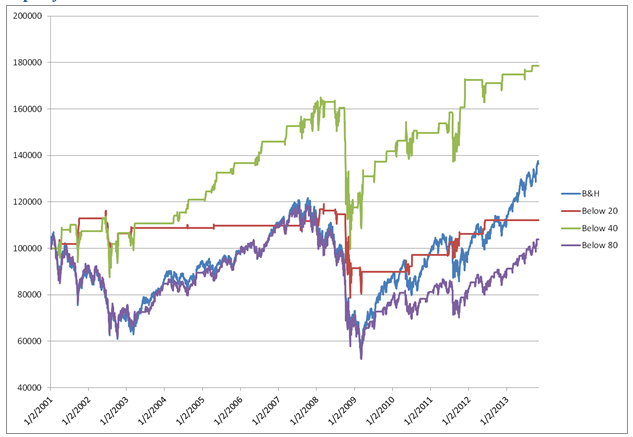
From “Percent S&P500 Stocks Trading Above MA50 as Market Timing Indicator,” Ronen asked to see equity curves for the following variations: Buy & Hold, Below 20, Below 40 and Below 80. One can see how they all get hit in the 2008 Crisis. Below 40 was the first to get to new highs and has continued to perform well.
Spreadsheets
If you’re interested in a spreadsheet of my testing results, enter your information below, and I will send you a link to the spreadsheet. Included are yearly breakdown of returns, 3, 6, 9, & 12 month ranking, and 10, 20, & 50 positions.
Final Comments
This will be the last post of the year. I will busy with FTC Robotics with my son and visiting family. To be notified of future posts, sign up for email alerts. Keep the great comments and research suggestions coming. I enjoy doing the reader request research. Enjoy your holidays!
Backtesting platform used: AmiBroker. Data provider:Norgate Data (referral link)


