- in Research , Stocks , Trend Following by Cesar Alvarez
Stops and trading high vs low volatility stocks
In my last post, Should one trade high or low volatility stocks?, we placed stocks into three volatility buckets and compared their performance. Several readers pointed out that using a fixed percentage stop made it more likely for high volatility stocks to hit the stop thus not performing as well. Readers suggested using an Average True Range stop or a time stop. We will explore those two stops and see how the volatility buckets compare.
Individual Trade Quality
Before we get to the tests, I need to explain a new metric I will be using. At Connors Research we use Individual Trade Quality, ITQ, when we were comparing results of non-portfolio tests, such as these tests. The simple way to understand ITQ is it analogous to Sharpe Ratio in a portfolio test. To get more details on ITQ see How to Measure the Individual Trade Quality of Your Strategy.
Connors Research has adopted a measure of risk-adjusted return per trade which uses concepts similar to those incorporated in the Sharpe Ratio, but translated to individual trades. We call this measure “Individual Trade Quality”, or ITQ. So, with other considerations being roughly equivalent, the trader would choose signals from the system with higher Individual Trade Quality. Individual Trade Quality is calculated according to this formula:
ITQ = (Average % Profit/Loss per Trade) / (Standard Deviation of % Profit/Loss per Trade)
The test
Date range from 1/1/2004 to 12/31/2013. The ranges for each of the tests are changed because we want each of the buckets to have approximately the same number of trades.
Buy Rules
- Stock has 21 day moving average dollar-volume greater than 10 million over the last 3 months
- Close is greater than $5
- Six month return is greater than 10%
- Close is greater than the 200 day moving average
- The SPX close is above the 200 day moving average
- The stock’s 100 day historical volatility(HV100) is between in one of the HV ranges for the last 5 five days
Sell Rules
- 15% trailing stop evaluate at the close
15 % Stop
The ‘avg. % p/l’ and the ITQ are much better for the lower volatility stocks. The lowest bucket has 2.3 times the return with an ITQ 2 time better. Readers pointed out that this stop method favored the lower volatility stocks because the higher volatility stocks are getting stopped out early. The ‘Avg Bars Held’ suggests this is true. What about the other stop methods? Will this change how we view each bucket?
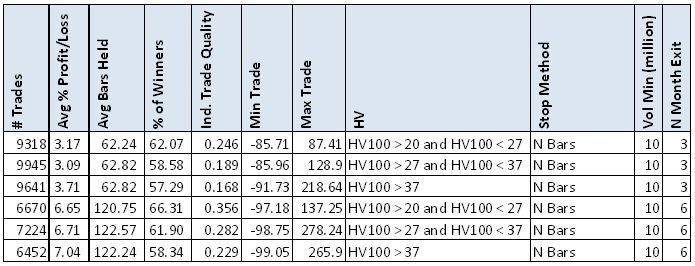
N Month Stop
We replace the trailing stop rule with a N month stop. This stop method favors the higher volatility stocks because they should move more in the same amount of time.
The ‘avg. % p/l’ is better for the highest volatility stocks but not by that much. The ITQ values are closer but the lower volatility stocks’ ITQ are 50% better, a substantial difference along with having a higher ‘% of Winners.’
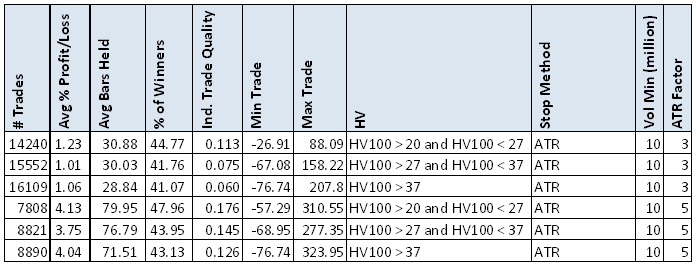
ATR Stop
We replace the trailing stop rule with a (3,5) x ATR(10) trailing stop. This test uses a stock’s recent volatility as stop and therefore should be a fair comparison.
The ‘avg. % p/l,’ ITQ and ‘% of Winners’ are better for the lower volatility stocks. Using an ATR stop points to trading lower volatility stocks, unless readers have other suggestions to try or different interpretation of the data.
Several interesting stats from this test:
- The average hold is about the same in all cases
- The ‘% of Winners’ took a substantial drop from the previous tests
- For the lowest volatility stocks, ITQ took a substantial drop
Any theories on the above?
Spreadsheet
If you’re interested in a spreadsheet of the data used to generate these tables, enter your information below, and I will send you a link to the spreadsheet. The spreadsheet includes more variations.
Conclusions
Testing the three stop methods, the data points to that trading lower volatility stocks leads to better results using ‘avg. % p/l,’ ‘% Winners’ and ITQ as our metrics.
Backtesting platform used: AmiBroker. Data provider:Norgate Data (referral link)


