- in Research by Cesar Alvarez
Strategy Up/Down Capture
A reader sent this interesting link about Up/Down Capture. The great part about this article it is something I have intuitively known about my trading strategies but never tried to quantify. This was the bump I needed to investigate this concept. When the SPY moves up on average how much does my strategy profit? When the SPY moves down how much does my strategy lose? I had fun creating an interactive spreadsheet where you can change the numbers and see the results for your own strategy. This is one of the best spreadsheets I have done for the site.
Base Test
The letter at the link used monthly timeframe. Since my trading is much more frequent, I decided to do the analysis on the daily timeframe. This test will cover from 1/1/2006 to 7/31/2016.
Up Capture
To calculate Up Capture one takes the percent return of your strategy divided by the percent return of the SPY for each day the SPY is up. Then one averages all these numbers. For example if the SPY is up 1% today and your strategy returned 1.2%, then the Up Capture for the day is 120%.
Down Capture
To calculate Down Capture one takes the percent return of your strategy divided by the percent return of the SPY for each day the SPY is down. Then one averages all these numbers. For example if the SPY is down 2% today and your strategy returned -1.0%, then the Down Capture for the day is 50%.
SPY Only
First we will look at the SPY only. We will look at different Up/Down Capture values and see how our results change. In the spreadsheet, on the “2006Daily” sheet change cells B7 and B8. We will be looking at a spread of 10 points. We will be looking at 120/110, 105/95 and 90/80 for Up/Down Capture values. Up Capture of 120% means when the SPY is up today, we wills that we are up 120% of the SPY.

The first column is our base case where we get 100% of both directions. My intuition was that the 120/110 would be produce significantly better numbers compared to all others. The 120/110 did dramatically improve on 100/100 for Compounded Annual Growth rate. I was surprised to see that the Maximum Drawdown also improved. What really caught my attention was the 90/80. It did 82% of the 120/110 total return but with a smaller MDD at 32.5%. It shows one that if you want to reduce your drawdown focus on your reducing your Down Capture. Well my intuition was not quite right here. If I had to pick one of these to trade it would be the 90/80.
But what happens during bull markets? Will 90/80 underperform 100/100? That was my guess.
SPY from 2012
Let us look at the stats from 1/1/12012 to 7/31/2016. A good strong bull run. Does 90/80 lag 100/100?

Well this was a definite surprise. While 120/110 continues to shine, the 90/80 still does significantly better than 100/100.
My Strategy
This is what I was excited to see. What values did my strategy have? I expected both my Up Capture and Down Capture to be below 100. But how much lower, I had no idea.
My first attempt to calculate Up/Down Capture failed. For each up day, I calculated my Up Capture and then took the average of these Up Capture days. The problem I ran into is the following example. Say the SPY is up .01% and my strategy is up 2%. That would give me an Up Capture of 200. These large value would mess up my average. When I took the values for Up Capture and Down Capture and put them into the spreadsheet, I got results for CAGR and MDD way different from the actual strategy.
The method I settled on to calculate Up/Down capture is as follows. On days the SPY is up, I calculate my strategy’s return. I then take the average of all these returns and divide it by the average up day of the SPY. When I dropped these calculated values inot the spreadsheet, I got a CAGR and MDD very close to the actual results.
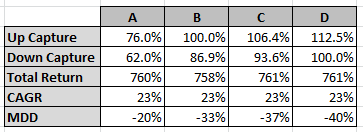
My calculated Up/Down values are 76/62. I was very surprised on how low both these values are. Now came the fun part, playing with the numbers and the spreadsheet.

Column A is my strategy. Next I wanted to know given an Up Capture of 100, what Down Capture value would I need to have the same Total Return as the original strategy. In Column B, we can see that a Down Capture of 86.9% is needed. But the MDD takes a huge jump to 33%.
Column C, I wanted to have an Up Capture equally distant from 100 as the Down Capture. Again the MDD increases.
Column D, I set the Down Capture to 100 and determined what Up Capture was needed to match the return. With a Up Capture of 112.5 we match the return with yet again a jump of MDD.
Spreadsheet
Fill the form below to get the spreadsheet that allows you to enter your equity data to determine your Up/Down Capture. My inner Excel-geekiness came out doing this. If you have any questions on how to use the spreadsheet add a comment below or contact me.
Final Thoughts
The main lesson I took from this research is that if you want to lower your drawdowns one needs to focus on Down Capture.
Backtesting platform used: AmiBroker. Data provider:Norgate Data (referral link)
Good Quant Trading,

Fill in for free spreadsheet:
![]()

