- in Research by Cesar Alvarez
Taming High Return and High Risk
I was at a recent talk of the Northwest Traders and Technical Analysts group where they presented a VXX strategy with some huge return and drawdown numbers. Trading this would be very difficult. This got me thinking. If I had a strategy like this, how could I tame the numbers? Through the years, I have seen various ideas about how to do this but never looked into it. Searching the web one can find various volatility ETF strategies with very high returns and high drawdowns. I found one that looked interesting and had lots of potential for optimization and improvement. Then, I optimized the hell out of it searching for a variation with over 100% CAGR. I found one but I would never trade it because I over fit the data. I needed to something to work with.
The Base
The results are of trading this strategy with the entire portfolio amount. The strategy trades a basket of volatility ETFs but can only be in one at a time. Test is from 1/1/2011 to 8/31/2016. All examples assume that the portfolio starts with $100,000. No interest on cash.
Yes, these are crazy high numbers but you get that when you over fit and trade volatility ETFs. No, I will not share what the rules are because I don’t want to risk anyone trading this. Sorry, that is not the point of this post.
How do we tame the drawdowns?
Method 1: Fixed Cash
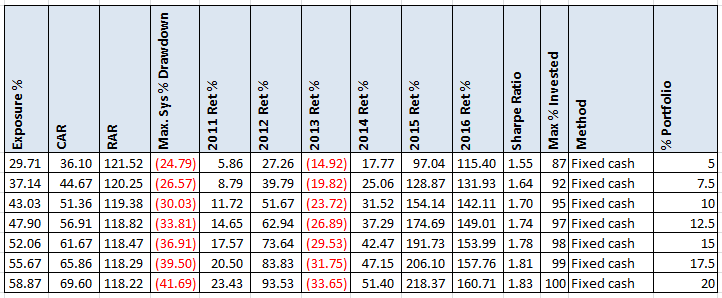
The first method we will look at is what I call Fixed Cash. You pick a percentage value you allocate to cash. The rest gets allocated to the strategy. You then let the strategy side compound while keeping your original cash amount.
For example, we choose to start with 10% in the strategy and 90% cash. That means our first trade will be allocated $10,000. When the strategy exits and then gets a new signal, the next trade will use total cash minus the original $90,000 of cash. This lets the strategy quickly outgrow the initial allocation. One can see that even at starting with 5%, the portfolio eventually gets to be as much as 87% exposed. At 15% and above, the maximum exposure nearly becomes 100%. This method does not make sense because one is back to the possibility of a large drawdown in the account. The drawdown did come down but not as much as I would like.
Method 2: Yearly Rebalance
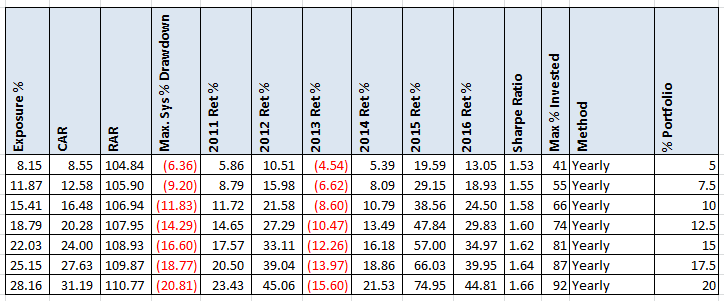
The Yearly Rebalance method takes the first method but only applies at the beginning of each year. This is the most common I have seen purposed on the web. At the start of a new year, the strategy rebalances the portfolio so “% portfolio” is our target. The method allows the results to compound for the year.
Now this is producing much more tame numbers. This still has the downside of the first method that your max % invested can get very high compared to what it started with. The 10% initial allocation had a max percent invested of 66%. What happens with more frequent rebalancing?
Method 2: Semi-Annual Rebalance
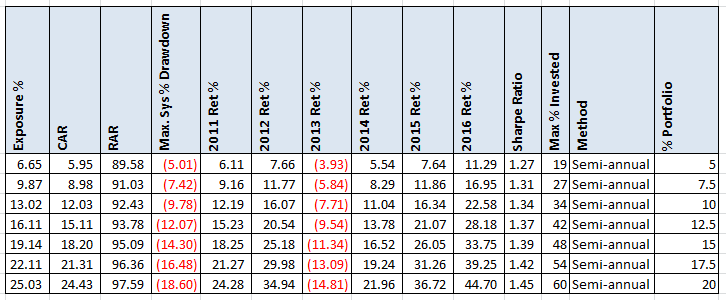
Now the portfolio rebalances to the target every 6 months.
Again we have much tamer numbers and the “Max % Invested” is coming down towards our initial “% portfolio” amount. What about quarterly rebalance?
Method 3: Quarterly Rebalance
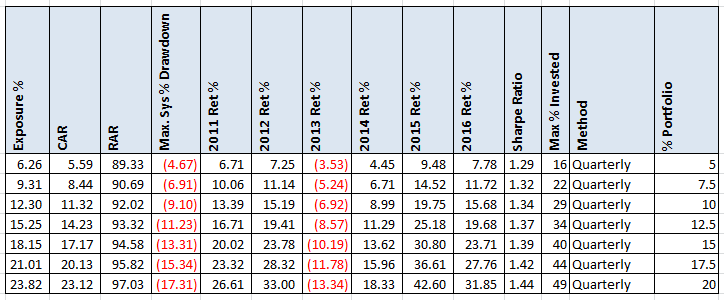
Now the portfolio rebalances to the target every 3 months.
The numbers are still looking good with “Max % Invested” coming down even more.
Method 4: Before Trade Entry
This method is a little different than the previous ones which can rebalance while in a trade. This method waits for the trade to entered and then resets the portfolio back to the to the target “% portfolio.”
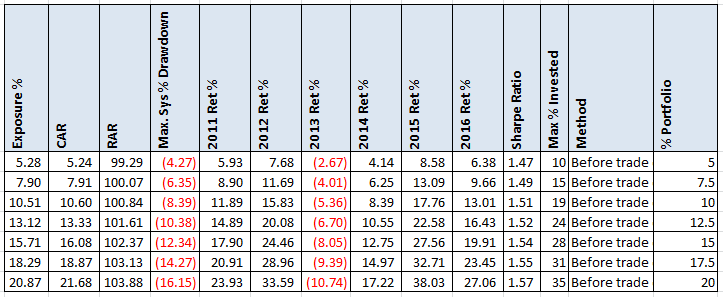
These numbers I really like. That the “Max % Invested” is only about twice the target is a great bonus for me. This makes sense since the largest winning trade is almost 100%.
Target CAR
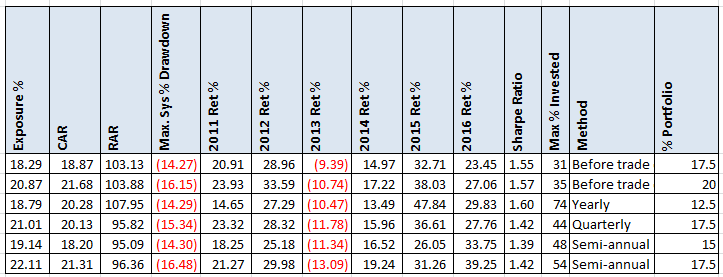
After generating all these numbers, I realized that it would be easy to target a portfolio to any metric I wanted by varying the “% Portfolio” variable. For example, I want a portfolio with a CAR near 20%. Here they are.
I would trade the “Before Trade Entry” method at 17.5%.
Target MDD
What about if I want single digit drawdown and double digit return? Here are those.
Spreadsheet
Fill the form below to get the spreadsheet which contains “% portfolio” values from 5 to 100 along with additional statistics.
2/28/2018: Read XIV Barbell Strategy for more on this concept.
Backtesting platform used: AmiBroker. Data provider:Norgate Data (referral link)
Final Thoughts
It is interesting that the original strategy had a CAR/MMD ratio of 2.0, while all the methods yielded a 1.2 to 1.4 ratio. These methods seem to be a valid way to tame the drawdowns. My favorite method being Before Trade Entry. Now I just need to find a strategy that makes 100% per year.

Fill in for free spreadsheet:
![]()


