- in General , Mean Reversion by Cesar Alvarez
The ABCs of creating a mean reversion strategy – Part 1
I was recently interviewed on Better System Trader, click here for part one of the interview, about the steps for creating a stock mean reversion strategy. I will be covering and expanding on the topics from the interview. These steps, for the most part, would apply to any strategy one is creating. The focus will be a long stock mean reversion strategy using daily bars.
What is Mean Reversion (MR)?
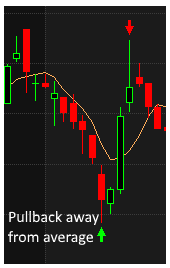
Mean Reversion is also known as pullback trading. The idea is that a stock that has made a strong move down in the last few days is more likely to bounce back up. Another way of looking at this as a stock moves away from the average price, it is more likely to bounce back to (and through that average).
Benefits/drawbacks of Mean Reversion
Some of the pros of MR strategies are they have short hold periods of 3 to 7 days. They perform well during volatile times.
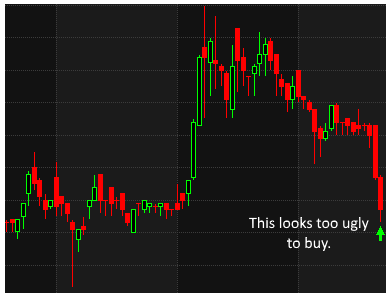
Some of the drawbacks of MR strategies are as follows. During low volatile times, like we have now, they can stay mostly in cash which can be frustrating. They work better without stops, meaning it is best to wait for the bounce. It can be really hard to pull the trigger on trades because the charts often look ugly. For the longest time, I had a note by my computer that said, “close your eyes and push the button.” Here is a recent trade that I had to enter.
Goals/targets
When developing any strategy, you need to have goals or targets for that strategy. The metrics I focus on are Compounded Annual Return (CAR), top five maximum draw downs, top five maximum draw lengths, smoothness of equity curve and fit with my other strategies.
For CAR, I look for returns between 20 and 35% per year. This is mostly influenced by my trading universe.
For drawdowns, I am not looking for really low numbers. I avoid strategies with drawdowns under 20% because I believe that they are setting a false expectation. These strategies typically have low drawdowns because they got lucky and avoided some bad trades. I tend be happy with a range between 20 and 35 percent. I know a lot of people want CAR to be 2 times more than MDD. When you do find those strategies understand that everyone else is looking for the same thing. By not caring about having MDD greater than CAR, I am looking for strategies that others are avoiding. Which is good.
For draw lengths, I want values of less than one year. It is harder to be not making new equity highs then going through a steep but quick drawdown. This stat is under-appreciated.
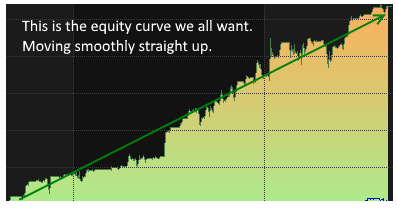
For smoothness of equity curve, I used to look for a nice looking equity curve. We know what it looks like. It goes up in a nice steady line. About a year ago, I realized that this is what everyone else is looking for and again it is probably a product of good luck or avoiding bad luck in the trades. Now I try to avoid the really smooth curves.
For fit, I want the strategy to complement my other strategies. I look at rolling 1-3 month correlation of the equity curve. I want values all over the place. I don’t want the strategy to always be strongly correlated with another strategy I am trading. When I combine the strategies, I want the overall drawdown and drawlengths to go down.
These are what I focus on. Each person needs to decide what stats they will focus on and the values they are looking for. These can include Sharpe Ratio, % winning trades, Ulcer Index and many more.
Trading Universe
The selection of your trading universe will have the biggest impact on your strategy. If you are looking for a high CAR strategy, you will not find it by trading S&P100 stocks. If you are looking for a low volatility strategy, then don’t trade those low volume low priced stocks.
The trading universes I focus on are S&P100, S&P500 and Russell 3000. The one I pick depends on my goals. For a higher CAR, I will focus on Russell 3000 stocks. For lower volatility I will focus on S&P100 or S&P 500 stocks. For those of you with easy access to foreign markets, these are also great places to trade if you can handle the volatility. These markets have better MR results.
Beyond the universe, you need to decide on how little liquidity are you willing to trade. I focus on average dollar-volume over the last month. If I plan to be trading $10,000 per position, then I don’t want to be more than .5% of the dollar-volume. Preferably even less. Meaning, I want the stock to be trading at least $2 million per day.
The last part to consider is price. How low of price will you trade? Once you get below $5, stocks tend to become much more volatile. Also depending on how your commission structure is, going under $1 may be problematic. Say you pay $.005/share for commission and you want to buy $10,000 of a $.50 stock. That comes out to $100 in commission in and another $100 out for a total of $200. That is 2% of your $10,000 and that is hard to make up.
How to measure daily mean reversion
So how do we determine if a stock has pulled back over the last few days? There are lots of technical indicators you can use. Is one the best? No. Each one works and there is a large overlap between them. Use the one that you like and get good results with. Here are some that I have used. For AmiBroker users, I have provided a download that has all these in it.
Relative Strength Indicator (RSI): There should be no surprise that this is the first one I list since a good portion of my posts reference it. I use very short lengths from 2 to 4 days. For example, 2 day RSI under 5 works well.
ConnorsRSI: Using the default values, I like to see values under (10,15). To learn more about ConnorsRSI, see this post. A value of ConnorsRSI under 10 is a great signal for pullback.
%B (percentB): %B is the closing price relative to the upper and lower Bollinger Bands. A value of 1 is when the close is at the top band. A value of zero is the close of the bottom band. See here for the calculation. My typical use a length of 5 or 10, a standard deviation of 1.0 or 1.5 or 2.0. Then I filter for %b to below 0 or -.1 for one to three days.
Moving average stretch: Here we want the closing price to be stretched below the moving average. For example, the close is 5% or more below the 10-day moving average. I like using the 5-day moving average and a close (3,4,5)% below it.
Rate of Change: How much has the stock sold off in the last N days. This is simply close today divided by the close N days ago minus one. I typically look at (3,5,10) days back. As to how much it has sold off, values between 5 and 15% work well.
Days down: This simple idea works quite well. The stock has closed (3,4,5) days down in a row is a good sign of a pullback.
N-day low: The closing price is a (5,7,10) day closing low. You can compare against the lowest low or the lowest close over the last N days. Again, simple but works quite well.
Closing range: Where is the current close vs the high and low of the last (5,10,20) days. The formula is (current close – lowest low of last N days)/(highest high of last N days – lowest low of last N days). I like to see this value under (.10,.25).
Once you have chosen your indicator, you need to decide on what values to use. For example, if you chose 3-period RSI, what values will be considered a pullback? The smaller the value the more stretched the stock is and the bounce will likely be bigger. But these trades happen less often. The value picked is often a trade off between the number opportunities and how well they perform.
Combining MR Indicators
You don’t need to pick only one indicator from the above list. I often will combine two of the together. There are two ways of doing this.
Confirming: The most common way I combine MR indicators is as confirmation. For example, I will have 2-period RSI less than 5 and three plus days down closes. With two indicators giving a signal, I feel more confident overall.
Stringent: The other method is two combine two indicators with very stringent requirements and only require one to be true. For example, 2-period RSI less than 1 or three day rate of change under -10%. Each rule is not likely to trigger often but together we may get more trades.
Last bar mean reversion
Besides a stock being over the last few days, I like to also see weakness on the last bar. My two favorite methods are rate of change and closing range.
Rate of Change: What percent was the stock close to close move? I like to see under minus 1 percent and even lower.
Closing range: Where is the current day’s range did the close happen? The formula is (current close – low)/(high – low ). I like to see this value under (.10,.25). This is also known as Internal Bar Strength.
Next
In the next post, I will continue with rest of the parts of the strategy. I will be covering additional filters. market regimes, signal ranking, position sizing, number of positions, entry method and exits.
Understanding mean reversion isn’t just about finding stocks that have fallen—it’s about developing the discipline to enter trades when charts look their ugliest and having the patience to wait for the inevitable bounce.
Got a question? Add it below in the comments.
Backtesting platform used: AmiBroker. Data provider: Norgate Data (referral link)
Good quant trading,

Fill in for free AmiBroker code:


