- in ETFs , Market Timing , Rotation by Cesar Alvarez
UPRO/TQQQ Leveraged ETF Strategy
Recently a reader sent me a leveraged ETF strategy that he wanted tested for the blog. Over the last couple of months, I have been noticing renewed interest in leveraged ETF trading. More clients are coming to me to test out leverage trading ideas. I have been testing my own ideas. What I liked about this strategy is that it moved between leveraged ETFs, non-leveraged ETFs and TLT.
The Strategy
On the last trading day of each calendar month:
Buy Rules
- VIX is less than or equal to 25
- S&P 500 is greater than 200 day moving average
- VWO has positive 1-3-6-12W momentum
- BND has positive 1-3-6-12W momentum
The 1-3-6-12W momentum is the average of 1 month return times 12, 3 month return times 4, 6 month return times 2, and 12 month return.
If A, B, C & D are true, then invest 50% into UPRO and 50% into TQQQ.
If either one or two out of those four rules are answered false, then invest 50% into QQQ and 50% into SPY
If either three or four of those four questions are false, then invest 100% into TLT.
Enter on the next open.
Repeat on the last trading day of each calendar month.
Test dates from 1/1/2010 (when have enough data to trade these ETFS) to 12/31/2023.
First Thoughts
The strategy seems to look for an up trending market with bonds and emerging markets doing well. I find it strange that it is using emerging markets as a filter and not US market since it is trading US market ETFs.
The default of using TLT when markets are not good, which worked great until 2022, is/was a common choice. It will be interesting to see the 2022 numbers.
Results
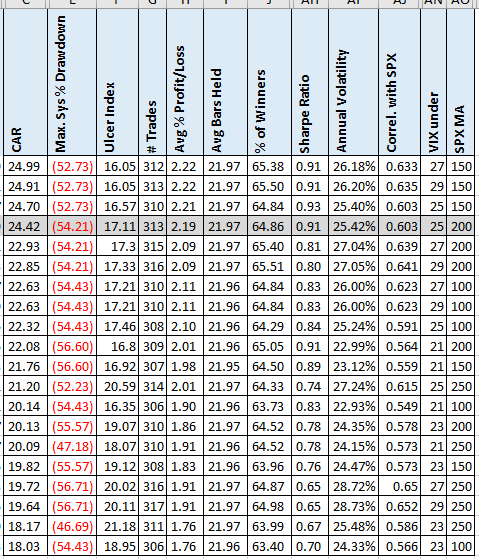
I also tested different values for the VIX entry and SPX moving average. The grey highlight are the original values.
The CAR of 24.4 looks good. But the max drawdown of 54 would be hard to stomach. Not shown here are the 2022 numbers (which you can see in spreadsheet). For the highlighted row the 2022 return is -48% with similar numbers for all the other variations. Ouch! The strategy looked great until then. Though you made up a good portion of it in 2023 with a 64% return.
Using VTI
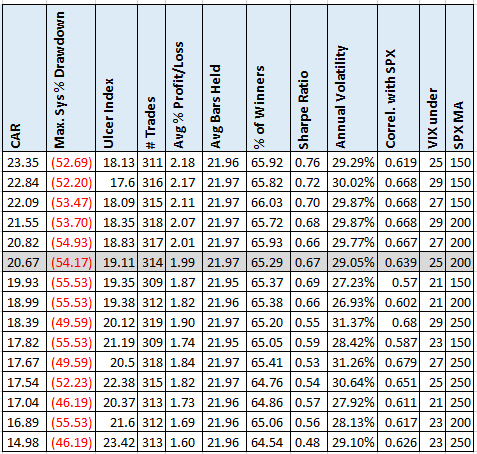
As I mentioned, I thought the use of VWO was strange. I wanted to see the results of using VTI instead.
Using VTI did not drop the results as much as I expected but still a significant amount of 15%.
Spreadsheet
Fill in the form below to get the spreadsheet with lots of additional information. See the results of all variations from the optimization run. This includes top drawdowns, trade statistics and more.
Final Thoughts
Creating ETF strategies is difficult because it is really easy to overfit the data. The overall rules for this strategy are simple and would make you think that the data is not overfit. But we don’t know how many ETF combinations were tried and what the test dates were. One thing I do like about this strategy is that it has a good number of trades. I have seen some with only 20-30 trades over this period.
What I have discovered in my own ETF strategy development is that bias can be introduced in simply the ETFs one picks. In this example, picking TQQQ is obvious because of the great performance it has had overall. Why not pick some other sector? Even if the rules seem simple and the values used ‘common’ or no-odd values, it does not guarantee it is fine. Lastly, was an in-sample and out-of-sample testing done on this strategy?
These are all questions you should ask yourself when you run into strategies (even mine). Especially ETF based ones. Given all the above, I think this strategy does have potential. The biggest issue is the defaulting to TLT when all is not working. This was a great rule during the very long bond bull market. Maybe a new rule to make sure TLT is an uptrend? I will be researching this strategy more.
Backtesting platform used: AmiBroker. Data provider: Norgate Data (referral link)
Good quant trading,

Fill in for free spreadsheet:
![]()


