- in Rotation , Stocks by Cesar Alvarez
Using 52-week highs in a S&P500 monthly rotation strategy
One area of recent interest for me is trading rotational strategies on a monthly timeframe using S&P500 stocks and ETFs. Areas of exploration include Momentum and Dual Momentum. Recently I came across The Secret to Momentum is the 52-Week High??? on Alpha Architect, a blog I highly recommend on reading along with the quant mashup Quantocracy.. The article is a synopsis of research done comparing momentum vs. 52-week highs as ranking filters for a rotation strategy. A new idea I had not tried. What a great way to start the year, testing a new idea. Even though often they do not work out, one needs to be exploring all the time.
In the paper, they used 6 month holds which is much longer than I want to hold any position. I dropped the holds to one month and see if that would give me interesting numbers or not.
As a side note, my delay on posting this year is because I have been busy with my son’s FTC robotics team. I wish I could have done this when I was in high school. If you have high school aged children into math, science, building or programming, I recommend you check out FIRST. We have been doing this for seven years. It is a great experience.
Test Notes
Test dates are from 1/1/2005 to 12/31/2014 using the S&P500 stock universe as they existed.
The Rules
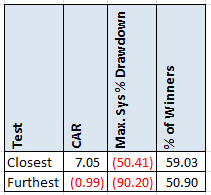
First we want to compare the top 25 vs the bottom 25 and see if there is something here.
Test 1: Closest To 52-week high
- Stock is in the S&P500
- On the last trading of each month, rank stocks from closest to 52-week high of closes to furthest.
- Buy the top 25 on the next open
- Sell all at the beginning of the next month at the open
Test 2: Furthest From 52-week high
- Stock is in the S&P500
- On the last trading of each month, rank stocks from furthest from 52-week high of closes to closest.
- Buy the top 25 on the next open
- Sell all at the beginning of the next month at the open
Results
A very promising start. As always we need to look deeper and compare to Buy and Hold.
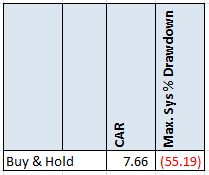
Buy & Hold
Comparing to buy and hold on the SPY, now the results don’t look so great.
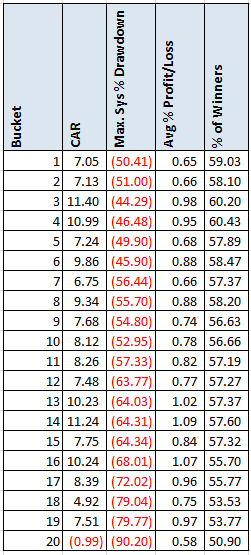
What about buckets?
Next we check to see if looking at buckets of 25 stocks each shows a pattern. This means the first bucket contains stocks ranked 1-25. The next bucket is from 26-50. And so, while the last bucket is stocks 476-500.
What I like to see is a pattern with the best results on top and they get worse as you move down. Of course it is never perfectly that way. Unfortunately we do not see that. What I take from this is avoid the bottom bucket, but then again that is an area most people are not trading.
Testing on the Russell 3000 stocks gave similar results.
Final Thoughts
Even though the 52-week high idea did not work for me, it does not mean that it does not work in the context as presented in the paper. This part of doing research, taking ideas that sound interesting and trying them for the context you want. The lesson to learn from this is always be looking for new ideas and test them thoroughly. Imagine had the first bucket returned 11%. We would have thought that the idea would work. It was by looking at all the buckets that we understand that it is noise.
Backtesting platform used: AmiBroker. Data provider:Norgate Data (referral link)
Good quant trading,

Fill in the form for the spreadsheet
For a spreadsheet with yearly returns and testing against Russell3000, fill in the form below.


