Using Stops: The Good, The Bad and The Ugly

I recently gave a presentation on Better System Trader about using stops on a breakout strategy. The research produced results I was not expecting and may be surprising to you. The stops tested are

  • No stops
  • Maximum Loss using ATR (Intraday and End of Day)
  • Maximum Loss using percentage (Intraday)
  • Trailing ATR (Intraday and End of Day)
  • Profit target using ATR (Intraday and End of Day)

The Strategy

Buy Rules:

  • Stock is member of the Russell 1000
  • Close is greater than $10
  • 21 day moving average of dollar volume is greater than $10 million
    Today’s Close is higher than highest high of the previous 252 trading days
  • Ten period ADX greater than 35
  • One hundred day Historical Volatility is greater than 35
  • Today’s DollarVolume is 25% or more greater than the 21 day average DollarVolume
  • Enter on next open

Sell Rules:

  • Exit after 6 months.
  • Exit on next open


Some Results

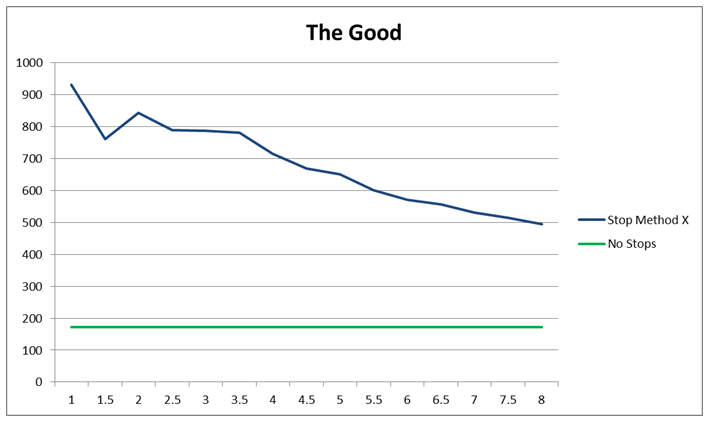
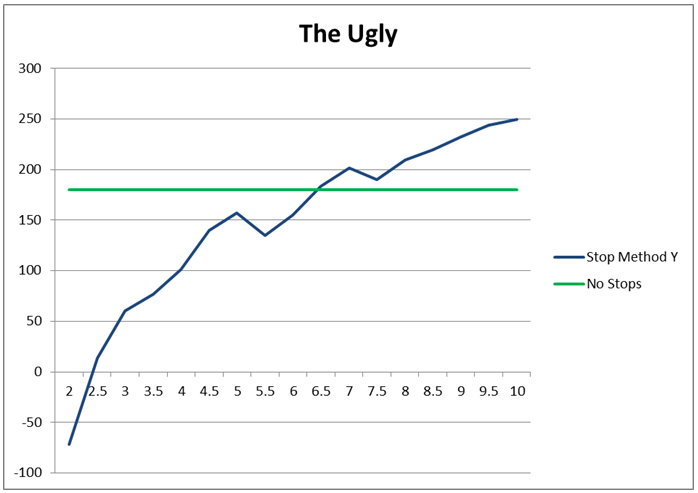
Charts from the presentation.

160106a

160106b

Downloads

To get the video of the presentation and the spreadsheet of the data, fill in the form below.

Thank you

I want to thank Andrew Swanscott for his great Better System Trader site. I highly recommend this site to all traders to help improve their trading and to get trading ideas. I know that I have learned a lot from the other guests on his site.

Backtesting platform used: AmiBroker. Data provider:Norgate Data (referral link)

Good Quant Trading,

Fill in for free spreadsheet and video:

spreadsheeticon


Visited 19 times, 1 visit(s) today

Click Here to Leave a Comment Below

Martyn Tinsley - January 27, 2016 Reply

Hi Cesar

A really great piece of research. I just listened to your interview about this on Better System Trader. I have done similar studies myself on Stops (although no where nearly as comprehensive as yours. I have used Van Tharps measure of R multiples myself for many years now. What I struggle to understand is how you managed to use an R value for the initial baseline (where you didn’t use any stops). I have always been of the opinion that for the R value measure to work you had to have a max loss stop to define R of 1 for the trade? i.e. it is that very fact that allows you to define what your downside risk for the trade is, and hence measure upside profit as a ratio of this. I only therefore use the R measure on my systems that do use stop losses. On my other systems I am forced to use an alternative measure and so struggle to compare like with like between systems that do and those that don’t use stops. I would REALLY appreciate therefore getting a little more information on how you do this for your initial baseline. I hope you find the time to reply.

Best Regards, Martyn

    Cesar Alvarez - January 27, 2016 Reply

    In ‘Trade Your Wat to Financial Freedom’ he mentions that if you are not using a stop then you can use the avg % loss as your risk amount. Then to get R multiple it is (% return of trade)/(avg % loss of all trades). I took a quick look but could not find the page/section that he made

Leave a Reply: