- in ETFs , Rotation , Stocks by Cesar Alvarez
Which S&P500 stocks to focus on when the SPX has 5 higher closes
Rob Hanna had a good post recently; titled What the String of 5 Higher Closes Under These Circumstances is Suggesting . With mean reversion trading, you are expecting stock prices to snap back towards their mean, like a rubber band stretched too far. But, sometimes, that rubber band can be stretched so far that it breaks (and therefore, won’t snapback). For some time, I have been searching for how to tell when that rubber band is stretched so far that it is broken. Rob’s post had several key concepts that might help us to solve this puzzle and possibly even be the foundation of a stock strategy.
Let’s walk through the steps I take when examining what looks to be good, solid research. First, I replicate the results. If I can do that (and you would be surprised how often I can’t), I then strive to understand the role of each of the rules, and how they affect the final results. Given Hanna’s research quality, I expected to replicate his results and I did.
The results for this post are from 2001 to the present. The date range was selected because that is when I have historical S&P500 stock data from.
Hanna’s Rules
- SPX closes up exactly 5 days in a row
- Close is greater than the 200 day moving average
- Close is not at a 50 day high of closes
- Buy on close
- Sell X day later
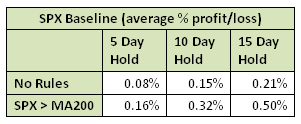
We will look at 5, 10, and 15 day returns. First we need a base line to compare future results against. Here are the average returns of the SPX over these hold times with no other filters.
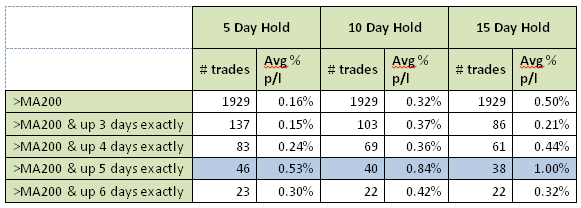
Right off the bat, it’s obvious that adding the MA200 greatly improves the base line results. Next, let’s see how adding the SPX “exactly N up days” changes the results.
For all trades in this set, the SPX “exactly up 5 days” are best. The rubber band appears broken with momentum already up. The results are between 2.0 times to 3.3 times the base line results.
Not at a N day high
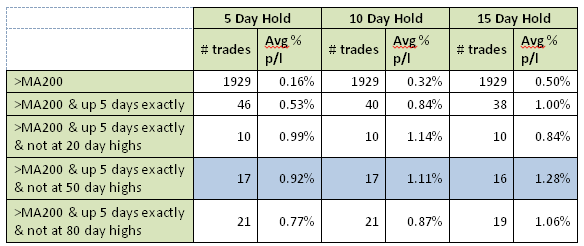
This is the rule I thought would make a big difference. I tried values of 20, 50 and 80 for N.
And this rule really popped the results. Not being at a 50 day high, the 5 day hold returns are now 5.7x the baseline, while the 10 day hold and 15 day hold returns are 3.5x and 2.6x the base line, respectively. The short term momentum seems strong. However, one caveat we must place with these results is the small sample size of only 17 trades. This is substantially less than I would like to see. But don’t forget what the goal is here: we are looking for a concept that might transfer well into a stock strategy. And the concept looks solid.
Testing on S&P500 stocks on SPX signal days
Next we want to see how the S&P500 stocks perform on those 17 signal days. The focus will be on the 5 day hold because that performed the best with respect to the base line. On the days that the filter criteria are met for the S&P, we buy the 500 stocks at the close and then hold them for 5 days, selling at the close.
As expected, the results are close to the SPX results of .92%.
Now on to the big question for today’s post. Can we find a ranking method for the individual stocks that will increase the results further? I’ve tried many ranking methods (as seen in the table below), and I am open to other ranking method suggestions.
From 425 trades per ranking method, the two highlighted methods stand out. One thing to look for in a good ranking method is above average results on one end and below average results on the other. The first, ‘High HV100’ does not surprise me because high HV stocks tend to have higher short term returns. The increase of the avg. % p/l to 1.52% is nice. The method that surprised me was the ‘Low ADX10’ ranking. It has a high win rate and ranking by ‘High ADX10’ produces one of the worst results. I have no good theory on what is going on here. Statistical anomaly? Does anyone have a theory that might explain this?
In the next post, we will take Rob Hanna’s concept and apply it to stocks directly without waiting for the SPX to signal. Maybe we’ll have the start of a short-term momentum system!
Backtesting platform used: AmiBroker. Data provider:Norgate Data (referral link)


