- in ETFs , Trend Following by Cesar Alvarez
XIV a heart attack waiting to happen
A research friend recently sent me a link to The #1 Stock In The World. Besides being a blatant title to get one’s attention (and it worked on me), I found the idea interesting along with my research friends. I have been trying to add either XIV or VXX to my trading in some small way. The article is only doing a buy and hold on XIV but it peaked my interest to try some other ideas.
Major Data Problem
Here is where I ran into problem right away. XIV did not trade until 11/30/2010. So it has had the benefit of a long bull run with declining volatility. Exactly the market that one would expect it to do well in. A little searching around and I found Six Figure Investing which has synthetic data back to 2004 for XIV. After purchasing the data, a comparison of the daily return of the XIV-Synthetic vs XIV from 2011 to 2014 has a correlation of 0.999+. Not too bad. I normally do not like using synthetic data because even with high correlation, individual days can vary dramatically. Since I was going to be testing longer holds, this should be less of an issue.
Buy and Hold
The article claims that XIV is a great buy and hold. Let us looking at some numbers.
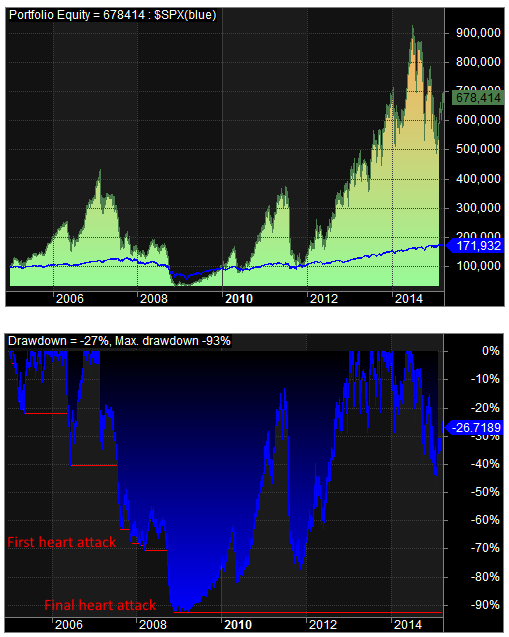
To put the returns and drawdowns into better perspective here are some charts.
Several triple digit years. That gets my attention. The CAR is good but those drawdowns! The worst one is 92%. No one can handle that. I have a friend of mine that regularly handles 50-60% drawdowns but I am sure this one he could not. What is amazing is that it made it back up.
Another major point about the 92% drawdown is that the ETN may have closed down. If you read the prospectus, you will see language that says they may close down the ETN if large losses are incurred. Well that sure seems large to me. Would you got your money back or lost it all? Would they then reopen it so you would have chance to make it all back?
What next?
Clearly buy and hold of XIV was not going to happen. The question is can we tame the drawdowns somehow and still get some good returns. I am looking for max drawdown in the 30-40 range and will see what kind of CAR that produces. The first thoughts I had was not allocating 100% of my capital to XIV but keep cash around.
Base rules
Test range from 1/1/2005 to 3/31/2015. From 1/1/2005 to 1/1/2011 we use the synthetic data and then after that we use XIV data. Entry and exit on the close of the rotation period. Tested rotation periods are weekly, monthly, quarterly and yearly. No commissions or interest on cash.
Idea 1: Percent in XIV
The first idea is one I read about when trading a volatile strategy that can generate high returns but with large drawdowns. What we will do is only invest X% of the portfolio value in XIV. Then at the rotation period we will rebalance to get back to this percent. Typically this value is said to be 10% or 20%.
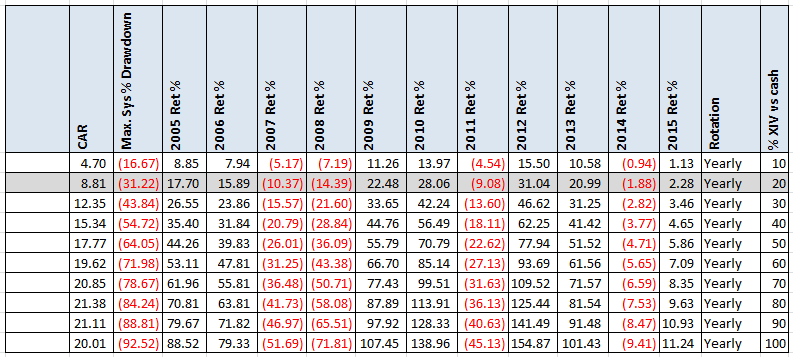
Yearly rebalance
At 20% in XIV, we have a CAR of only 8.8%. Not that great given the MDD is 31%. Maybe a different rebalance period?
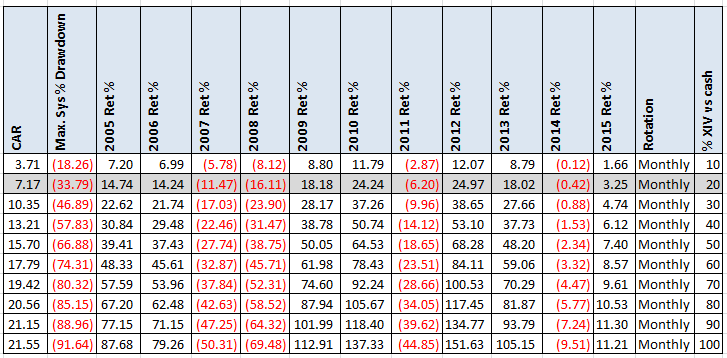
Monthly rebalance
Little change. On do different ideas.
Idea 2: Use RSI to determine percentage
The idea here is to be more allocated in XIV when is doing well and less when it is not. A simple what to test this is to use RSI. The RSI value will determine the percent we will invest in XIV for the rotation period. For weekly rotation, we will use weekly RSI. For the other rotation periods we will use monthly RSI. We will test various lengths for RSI.
Weekly rebalance with RSI
Nothing good here.
Monthly rebalance with RSI
Again nothing good.
Idea 3: Number of recent highs
The next idea comes from the researchers I was working with while exploring this. The general idea is counting how new highs have been made over the last N days and then ranking that value with all the other values in the last M days. Basically the less new highs you have made and the worse it is compared to the others, the more you invest. Think of this as a mean reversion of volatility. The opposite of idea 2.
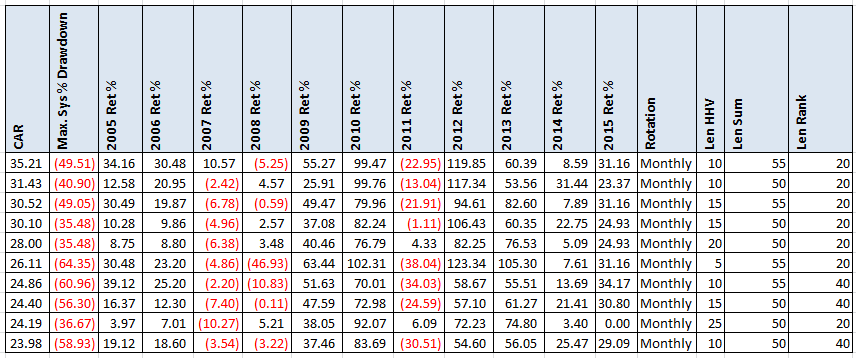
The AmiBroker code is “pct = PercentRank(Sum(Close<HHV(Close,lenHHV),lenSum),lenRank); .“
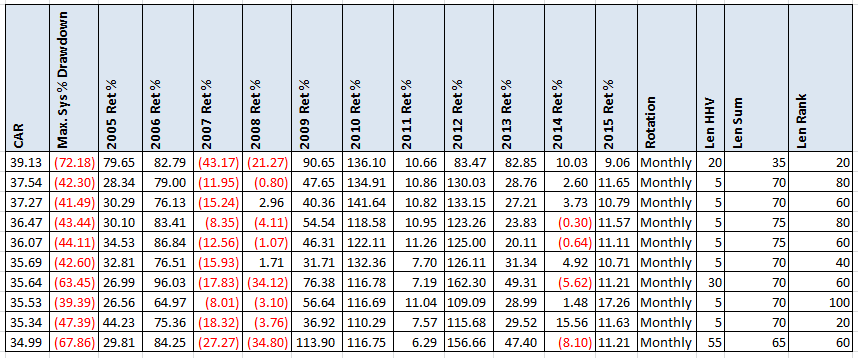
At this point I was becoming annoyed of lack of results and threw the optimizer at it and ran 18,000 variations. These are the results of the top 10 by CAR for a monthly rotation. Still huge drawdowns. The only good part is that 2008 is no longer bad.
Sometimes the opposite idea generates good numbers. I took the value from above and subtracted it from 100.
These had higher CAR, which at least confirms that you should ride the trend but those pesky drawdowns.
Just a leveraged SPY?
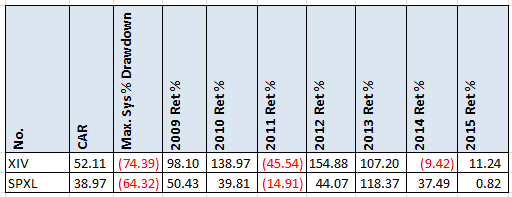
At this point I wondered if this was just a leveraged SPY strategy. The correlation between the SPY and XIV is .83 which is high.
Above is the comparison of Buy and Hold of XIV and SPXL (3x SPY). Even though the correlation is high the yearly returns can be very different.
Spreadsheet
Fill the form below to get the spreadsheet with lots of additional information. This includes yearly breakdown, worst 5 drawdowns and additional statistics.
Final Thoughts
When I got to near the end of this research, I discovered this article XIV And High-Beta Investments In Bull Markets. He compares XIV to a 3.4x SPY. In the end, I believe there is enough difference between SPXL and XIV to still look for something in XIV. The problem is dealing with the drawdowns. Even though I am willing to go up to 40%, I could not find any returns that felt compelling. Maybe only trading during certain markets? Got ideas? Add them to the comments and if I get enough interesting ones, I will do another post. Or any ideas to try on VXX?
As always, test what you read. Even though the original author may believe it may be a great trade, one needs to know what one is getting into. Like a 92% drawdown.
Backtesting platform used: AmiBroker. Data provider:Norgate Data (referral link)
Good quant trading,

Fill in for free spreadsheet:
![]()


