April 15, 2015

Re-balancing: Is it worth the time and effort?

David Weilmuenster is today’s guest author. David and I worked together at Connors Research for eight years and is one great researcher and AmiBroker programmer.

Brochures for professionally managed investments and academic white papers on long term investing almost always praise the benefits of regularly re-balancing a portfolio. The benefits can arise from the interaction, or correlation, of periodic returns among the constituent assets in a portfolio. As the correlations among constituent assets decrease, the long term returns of the overall portfolio generally will increase with regular re-balancing. This has become known as “the only free lunch in investing”, although it does not work out that way in all situations.

Let’s look at a couple of straightforward examples to illustrate some of the dynamics of re-balancing.

SPY/TLT

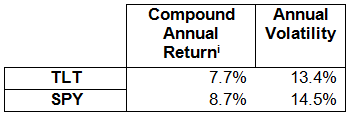
We’ll start with a portfolio consisting of two assets, SPY (SPDR S&P 500 ETF) to represent stocks, and TLT (iShares 20+ Year Treasury Bond ETF) to represent bonds. We’re not shooting for an ideal portfolio here, but one that with sufficient credibility to help us think about re-balancing. Here are some relevant statistics on the two ETFs from 2002-07-31 through 2014-12-31 (TLT was first available to trade on 2002-07-26):

150415A

The correlation of monthly returns for TLT and SPY during this history was -0.307. Given that the correlation is negative (i.e., low), we should observe the benefits described above in a regularly re-balanced portfolio of SPY and TLT. The following table shows the benefit for CAR[ii]:

150415B


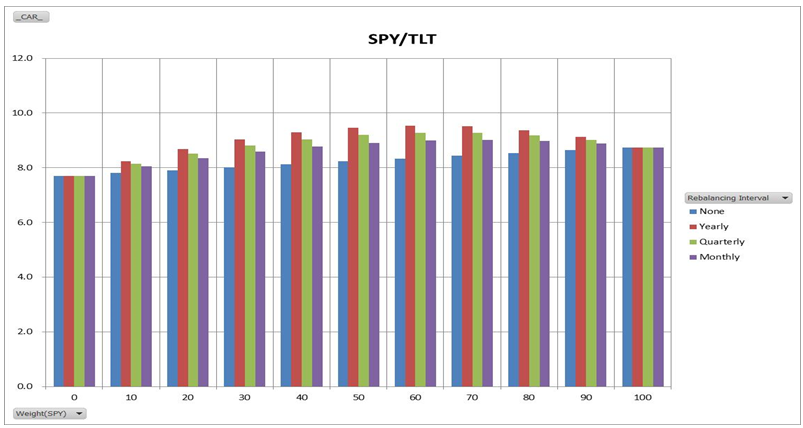
The horizontal axis is the percent weight given to SPY in the portfolio. We can gain as much as 1% extra in Compound Annual Return if we re-balance yearly (at calendar year end), and somewhat less than that if we re-balance Quarterly or Monthly. Of course, the answer varies with the weight that we assign to SPY in the portfolio. An additional return of 1% per year can add significantly to equity over the long run.

SSO/UBT

What if, instead, we trade the 2X Leveraged ETFs, SSO and UBT, that are based on the same underlying indices as SPY and TLT? Their statistics for the same time period[iii] are:

150415C


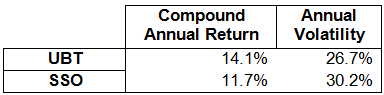
The correlation of their monthly returns was -0.330. In comparison to TLT/SPY, the individual annual volatilities are much higher, but the correlation of monthly returns is not much different.

Now the impact on CAR is considerably greater, as much as 3-5% in CAR depending on the weight assigned to SSO and the re-balancing periodicity. This is more pronounced than the effect on the TLT/SPY portfolio, even considering that the un-re-balanced “2X” portfolio has a higher CAR than for TLT/SPY.

150415D

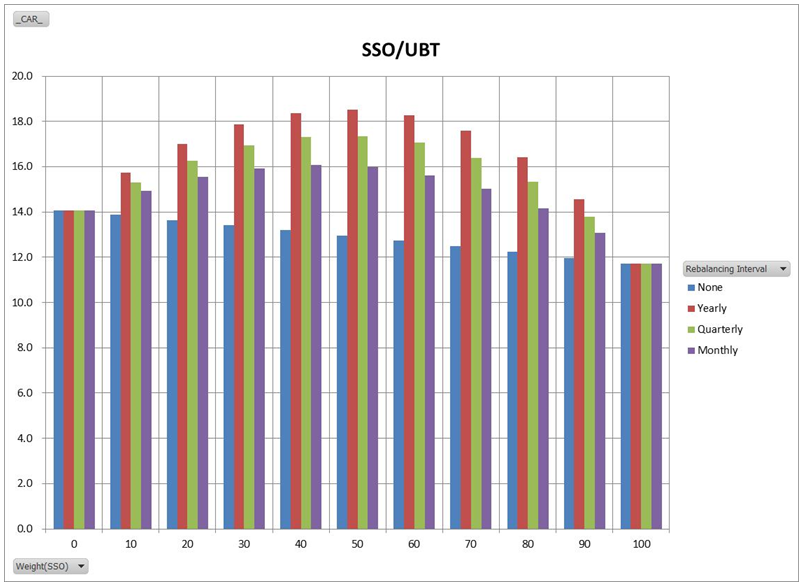
This example illustrates that the effects of re-balancing are generally more significant when the assets being re-balanced are more volatile on their own.

What’s the catch? Of course, there are several:

  • What does “yearly” re-balancing mean in practical terms? Does the effect on CAR change substantially if we choose to re-balance at the end of every February, rather than every December? The following chart shows that timing can make a noticeable difference.
  • 150415E

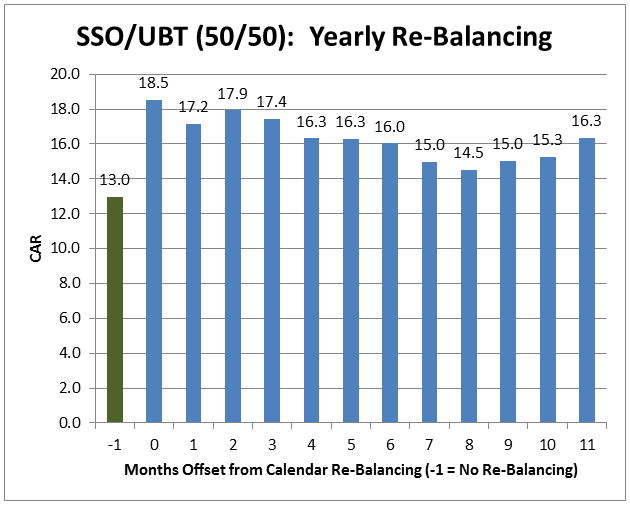
For example, re-balancing at the end of August (offset = 8) produces much less benefit to CAR for this portfolio than re-balancing at the end of December. The effect of timing is unique for every set of assets, so unfortunately, there is no general rule to guide us. And, quarterly re-balancing is subject to similar variability due to timing.

  • Our results ignore tax effects from gains and losses realized when re-balancing. They could be relatively negligible, or significant. Again, there is no general rule to guide us, except perhaps to re-balance less frequently. Note that, in these examples, yearly re-balancing outperforms more frequent re-balancing either quarterly or monthly over the long run. So, a less aggressive re-balancing schedule could both reduce tax effects and generate higher CAR (before tax).


  • Probably of least importance, we have not included transaction costs or slippage in this analysis.


Spreadsheet

Fill in the form below to get the spreadsheet with additional information: yearly returns, different weightings.

Backtesting platform used: AmiBroker. Data provider:Norgate Data (referral link)

Conclusions:

  • In a perfect world, regular re-balancing of a portfolio almost always improves long term returns (CAR), but there are real world caveats to consider, i.e., the periodicity and timing of re-balancing, tax effects, and transaction costs.


  • Even given the caveats regarding long term returns, regular re-balancing is probably worth the effort even if only to assure that no single asset, or small group of assets, grows to dominate a portfolio. I.e., regular re-balancing can be sound risk management, with the potential to increase returns through the effects that we’ve illustrated in this posting.


See the accompanying spreadsheet for other portfolio metrics, including annual returns, for the examples discussed here. They show, for example, that re-balancing does not generate higher returns in every year. Neither does annual re-balancing outperform monthly re-balancing in every year.

What are your thoughts on re-balancing?

David


[i] Includes dividends

[ii] Re-balancing on the Close of each calendar period; no Commissions; no Tax Effects

[iii] UBT and SSO began trading after 2002-07-31, so we created a “synthetic” version of each based on 2X the daily returns of TLT and SPY enable us to run the unleveraged and leveraged tests over the same timeframe.


Fill in for free spreadsheet:

spreadsheeticon


Click Here to Leave a Comment Below

Ilya Kipnis - April 15, 2015 Reply

IMO, blind rebalancing is just asking for trouble, since it necessarily means fighting against momentum–after all, something going up must have a reason to go up, and something on a steady decline down must have a reason to go down. For instance, on a thought experiment, consider, say, a hot rising company, and a company that may have been good in the past, but is now going down the tubes (Enron, Lehman, etc.).

Blind rebalancing would just lose you money for no particularly good reason.

On the other hand, the kinds of work that LogicalInvest has been doing are more interesting in that while there’s a regular re-weighting period, it isn’t necessarily a rebalancing back to some static allocation, but instead adjusting the portfolio based on some sort of metric to optimize (73-day lookback Sharpe ratio, for instance).

What would be more interesting, IMO, is comparing blind rebalancing with rebalancing designed to optimize some quantity (EG maximize Sharpe ratio, maximize Calmar, etc.).

    David Weilmuenster - April 15, 2015 Reply

    Ilya, thanks for your comment.

    You’re right that just “blindly” re-balancing any arbitrary set of assets won’t necessarily be helpful. A fundamental assumption underlying re-balancing is that the assets in the portfolio will appreciate in the long run, subject to short term volatility that re-balancing can harvest. But, no amount of math can convert a turkey into a winner.

    That same problem applies, however, to the work that LogicalInvesting has been discussing. One can certainly determine an ex post facto allocation that maximizes Sharpe Ratio, for example, but what if that maximum value is negative, indicating that the portfolio declined over the lookback period. Would you still want to trade it?

    Having said that, however, I’m still intrigued by the concept that LogicalInvesting has put forward. Perhaps in a future post we can offer compare some “blindly” re-balanced portfolios to the same portfolios re-balanced to achieve an historical performance benchmark,

Quantocracy's Daily Wrap for 04/15/2015 | Quantocracy - April 15, 2015 Reply

[…] Re-balancing: Is it worth the time and effort? [Alvarez Quant Trading] David Weilmuenster is todays guest author. David and I worked together at Connors Research for eight years and is one great researcher and AmiBroker programmer. Brochures for professionally managed investments and academic white papers on long term investing almost always praise the benefits of regularly re-balancing a portfolio. The benefits can arise from the interaction, or correlation, of […]

Chris - April 16, 2015 Reply

Why would you maximize the Sharpe ratio?

Why not maximize returns?

It is a more important metric in my opinion.

Of course if you want a smoother equity curve maximizing Sharpe is the way to go.

    David Weilmuenster - April 16, 2015 Reply

    Chris,

    It’s all a matter of one’s objective.

    As you suggest, if you want a smoother equity curve, perhaps maximizing Sharpe is the way to go. If you maximize historical returns at each re-balancing, you’ll likely get a very different outcome for the long term portfolio.

    Perhaps a future post can contrast the two approaches, in addition to comparing them to a fixed percentage re-balancing.

    David

      Doron - April 27, 2015 Reply

      David, great article with numerous quantitative insights on the effects of re-balancing and its robustness to timing.

      With respect to maximizing returns vs maximizing Sharpe, a historical lookback only tells you what happened, not what will happen next. In that regard, I’d be curious to know which historical measure or ratio (return, sharpe, calmar, omega, sortino, etc.) is likely to be more “sticky”, in a predictive statistical sense. The look-forward stickiness period has to be commensurate to the desired/expected holding period or, if you like, the re-balancing period. Just another idea for future research.

      Doron

        David Weilmuenster - April 27, 2015 Reply

        Doron,

        Thanks for your comment.

        The usefulness of sizing rotation positions to achieve an historical performance metric does hinge on that metric’s “stickiness” regarding the next rotation period. I’m unaware of any theoretical research that suggests that one metric might generally outperform all others in this regard. Unfortunately then, it’s a matter of testing alternatives in a specific scenario to suggest the best approach for each system.

        We may tackle this with future research in another post. It requires solving some of the calculation “overloads” that this kind of algorithm can generate.

        David

04/27/15 - Monday Interest-ing Reads -Compound Interest Rocks - April 27, 2015 Reply

[…] Is portfolio rebalancing worth the effort? (alvarezquanttrading) […]

Ricardo - June 6, 2016 Reply

Hello.
I am new on Amibroker. Can you post the Amibroker code for rebalancing a buy&hold portfolio, for example annualy at the end of the year, or when a specific asset weigh is +/-10% from initial weight? (2 assets its OK. Ideally should be used in a multi asset portfolio, but maybe is too complicated).
Thank you very much.
Ricardo.

Mark - October 24, 2017 Reply

The last bar graph has no SD lines on it. I wonder if this is a stable phenomenon (any difference between when the rebalancing occurs) or if it’s pretty much random with no significant differences between. We may not even have large enough sample sizes to detect significant differences here.

Leave a Reply: