The Health of Stock Mean Reversion: Dead, Dying or Doing Just Fine

My second post on this blog was a look at mean reversion, Is mean reversion dead? Given I am using a new data provider(Norgate Data), it has been almost two years since that post and there have been other articles on this recently, I figured it was time to check again. The research will focus on Russell 1000 stocks since 1995. The test is back to 1995 covers 3 bull markets and 2 bear markets.

Even though I tested back to 1995, because of the large spreads back then, I would take those results with a grain of salt.

The Test

Date Range: 1/1/1995 to 6/30/2015.

Entry:

  • Stock is part of the Russell 1000
  • Close > $1
  • RSI(2) < 5
  • Entry on Close

Exit:

  • RSI2 > 70
  • Exit on Close

I performed an “All Days” test. This means we can have multiple entries in the same stock at the same time. In a situation where an oversold stock continues on a journey downward day after day, the test will take each trade each day as a new independent trade if the stock continues to meet the filter criteria.

The Results

Number of trades

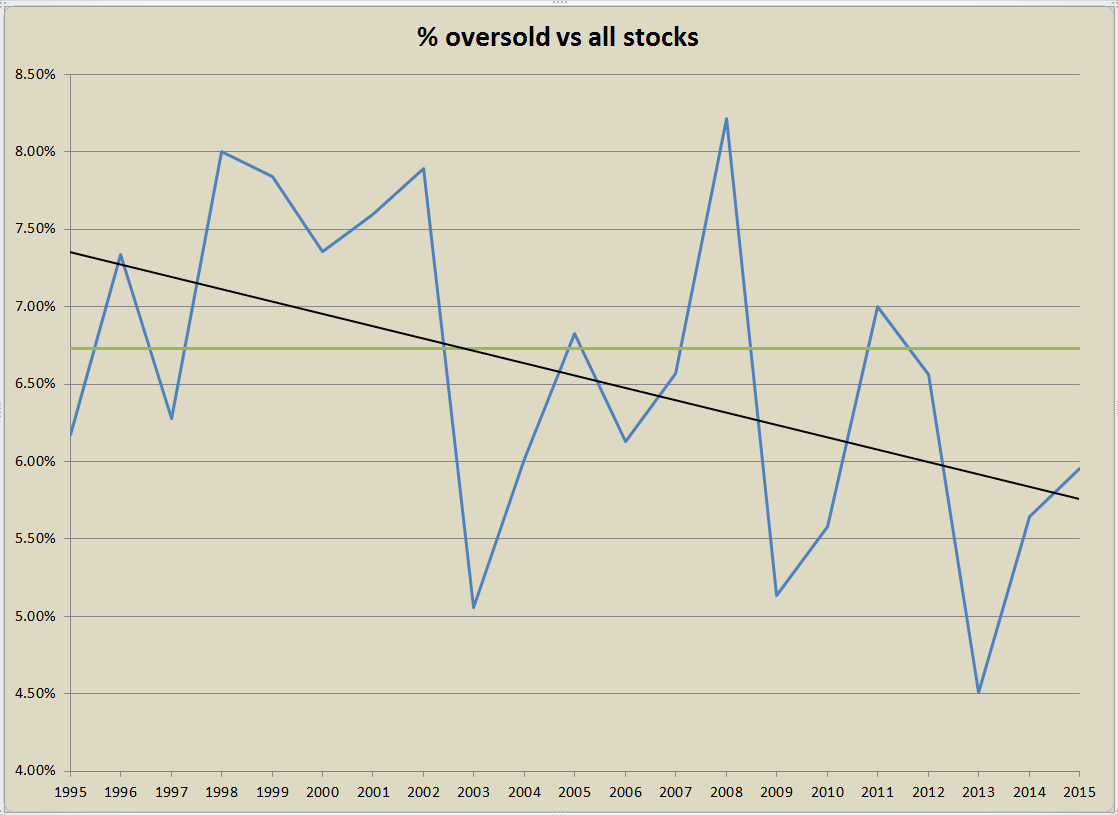
The first question is as a percentage is there fewer stocks becoming oversold?

150819a

The blue line is the percent of stocks with RSI2 < 5 compared to all the stock for a given year. This has hovered between 4.5% in 2013 and 8.2% in 2008. The black line is a liner regression of the data. We can see that the trend has been down since 1995. The green line is the average of 6.7%. Stocks are becoming less oversold.

Average % profit/loss

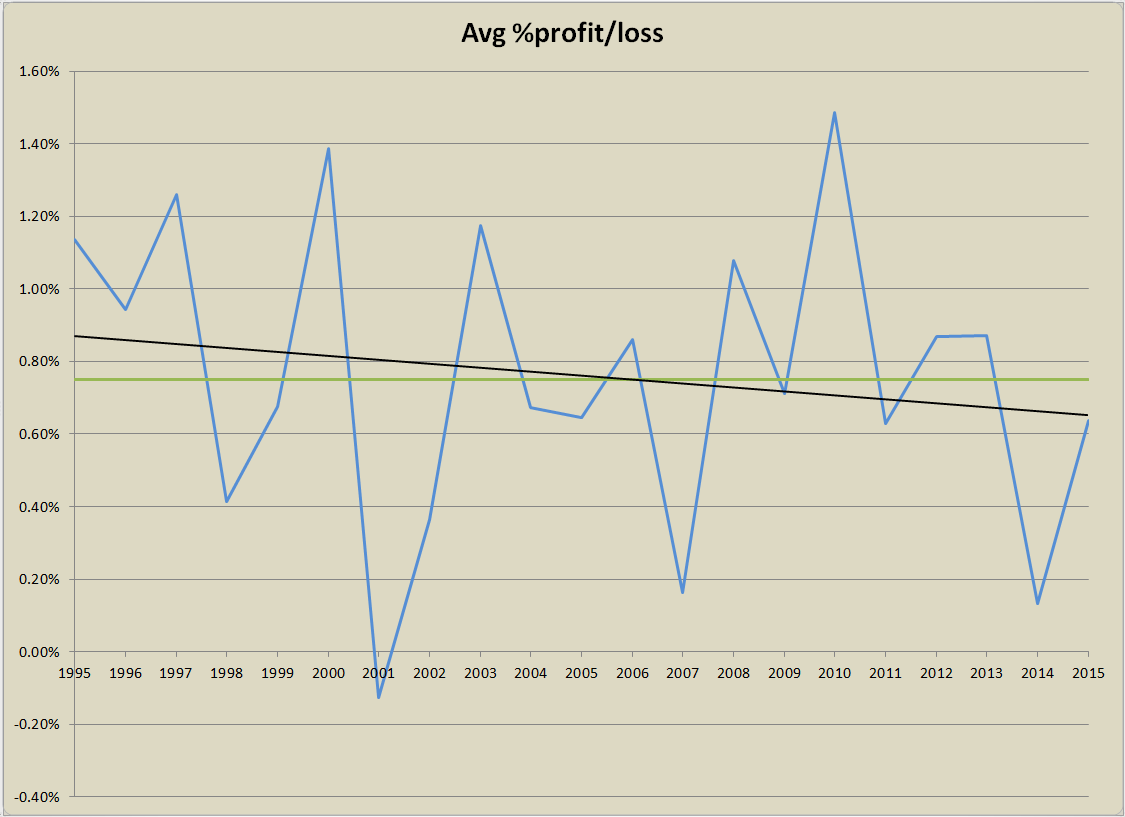
What has been happening to the average % profit/loss over the years?

150819b

The blue line is the average % profit/loss of all the trades with RSI2 < 5 and the exiting when RSI2 > 70. The black line is a linear regression of the data, which is barely sloping down. The green average line is at .75%. The 2014 number of .13% surprised me on how low it was. From this point of view, I don’t see anything that says mean reversion is dying or dead.

Average Day Hold

150819c

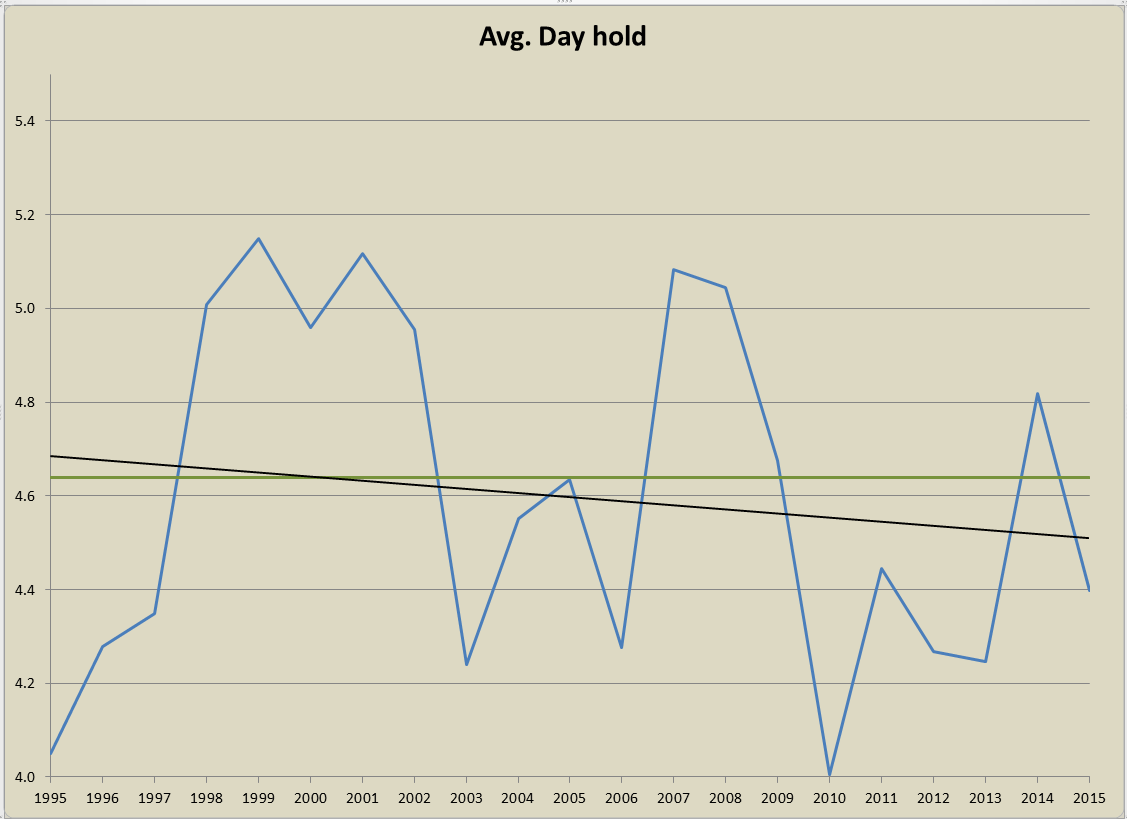
Looking at the average holding period, we can see a basically flat linear regression with a fairly tight range of holding period between 4.1 and 5.1 bars. No real changes over the years.

100 Day Historical Volatility

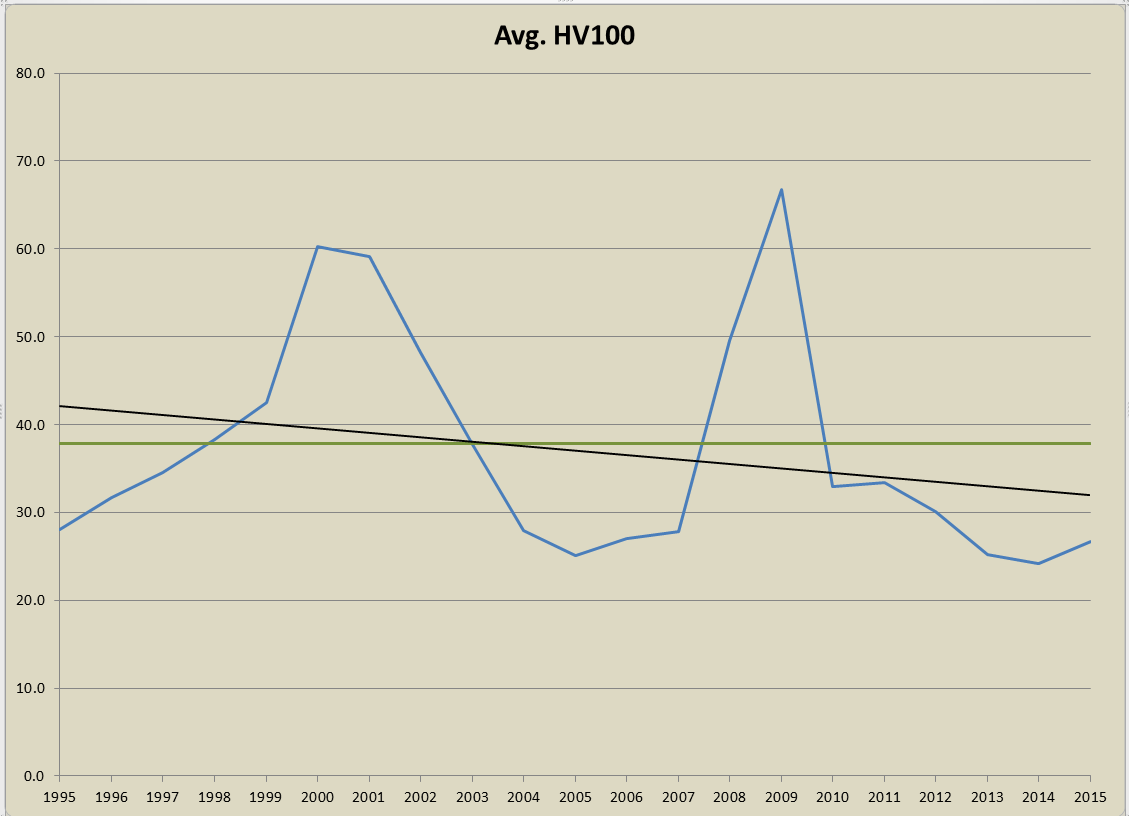
Are stocks not as volatile?

150819d

The volatility of stocks during bull market years seems be a range of about 28 to 35. Even though the regression slope is down it is only slightly. I see nothing to worry about.

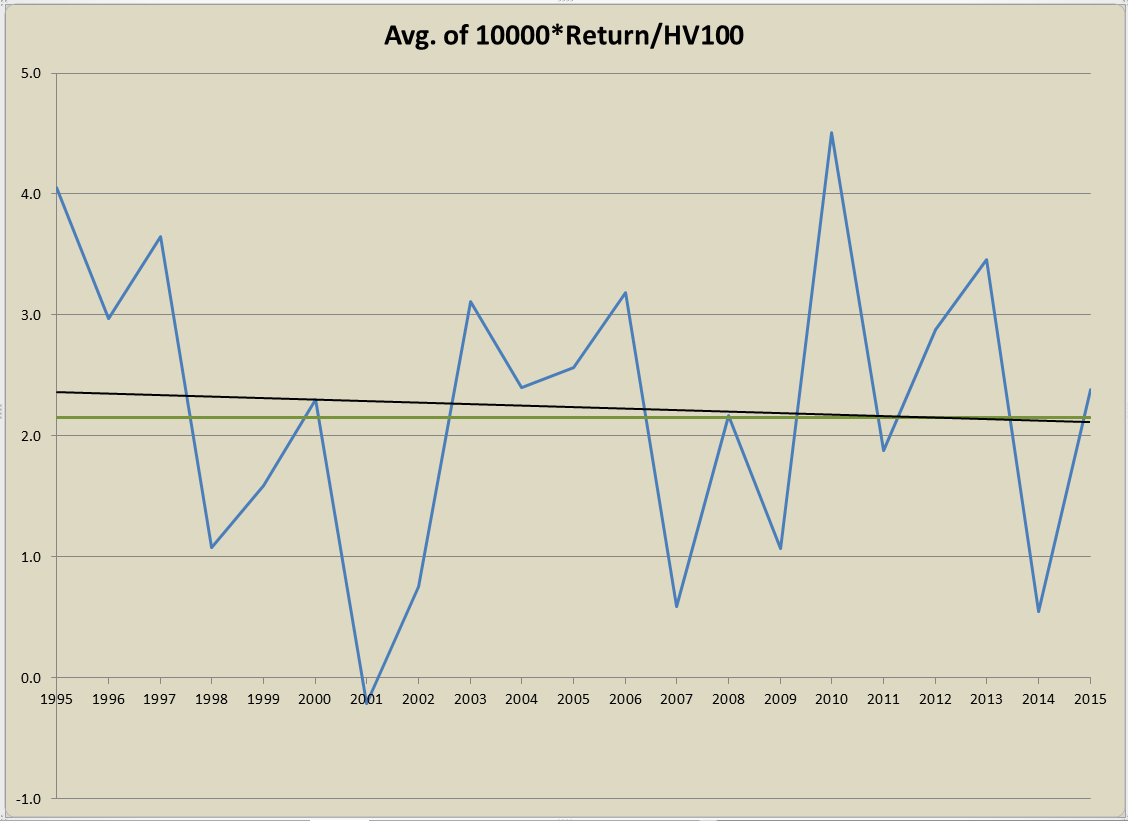
Ratio of Return to HV100

Maybe the return per unit of volatility is changing? For example a 2% return of a stock with a HV100 of 20 differs from a 2% return with a HV100 of 50.

150819e

The chart is showing the average of the return divided by HV100, then multiplied by 10,000. The 10,000 is used to give nicer looking numbers. I am not sure how to interpret this one. The numbers in late 1990’s are lower than expect but the mid 90’s are higher. An interesting chart but what does it say?

Spreadsheet

Fill the form below to get the spreadsheet with the yearly numbers used to generate this data.

Final Thoughts

Is mean reversion dying or dead? I don’t see that from the numbers above. The last two years have been tougher but nothing out of the ordinary from looking at the numbers back to 1995. Mean reversion seems to be doing just fine. Going through bad cycles and good ones.

Read the 2019 update: How is mean reversion doing? Dead, Shrinking or Doing Just Fine

Tell Me

Tell me in the comments how you read these charts and if mean reversion is dying.

Backtesting platform used: AmiBroker. Data provider:Norgate Data (referral link)

Good quant trading,

Fill in for free spreadsheet:

spreadsheeticon


Visited 17 times, 1 visit(s) today

Click Here to Leave a Comment Below

Tom Musselman - August 19, 2015 Reply

Despite your general point from your Connors days that rsi(2) has proven the best short-term indicator, my tests show that a simple 4 day stock return (low being good) works even better. If you are ever able to try it on your data that would be nice to confirm or refute this.

e.g. on a universe of all liquid stocks with pretty generous liquidity filters (price>$1, mcap>$100 million, on the market for at least 1 year, inflation-adjusted daily dollar volume in the last 63 days>$100,000), before friction, and hold for 5 days (no other sell rule), tested on all start dates Sept 2, 1997 forward to Aug 18, 2015 and then averaged CAGR, leaving an average of 3360 stocks in the universe to then test:
a. 17.6% cagr bottom 5% of stocks left by bad 4 day return (requiring price>ma200 was slightly worse than this at 17.4%; but requiring price<ma5 was better at 18.1%)
b. 16.0% cagr bottom 5% of stocks left by bad 5 day return
c. 14.6% cagr bottom 5% by rsi(2)
d. 14.7% cagr for rsi(2)<5
I have tested longer backtests on simpler liquidity filters (since my tests can't use all of the above filters on very long tests) and this still holds true: bad return in the last 4 or 5 days beats low rsi(2) for 1 week holds.

matt haines - August 19, 2015 Reply

Hi Cesar. Quick question about your data universe:

Are you using delisted stocks too?

Also, are you using stocks that were historically part of the R1000 at the time of the test, or using the current R1000 members only?

Thanks!

Viva Mean Reversion. 🙂

    Cesar Alvarez - August 19, 2015 Reply

    Yes, I am using delisted stocks and using the R1000 as they exited in the past. The link to Premium Data the beginning of the post will give your more details.

Cesar Alvarez - August 19, 2015 Reply

@Tom: I do use something similar for one of my strategies which is 3 day return. At the end of the day using a N day return or RSI or N down days or stretch under a short-term MA are all measuring recent weakness. As to which is ‘better’? Well everyone has their favorite and better changes year after year. If you like it better than RSI2, then trade it.

david varadi - August 19, 2015 Reply

hi Cesar, excellent analysis as always. One obvious explanation for the fall in gains per trade has been the falling transaction costs to execute over time—-factoring that in it may be the case that the gains per trade are nearly the same over time.

I would also point out that you may wish to look at a measure of the overlap of oversold opportunities. It seems that the biggest issue has been the greater correlation of stocks within the universe. This means that less unique opportunities/trades will occur, and most trades will occur when the market is oversold. One interesting method to use is the average of the correlation of each stock’s RSI when RSI< some oversold threshold to the equal weight or index RSI when it is < the same threshold. I would imagine this correlation has trended higher over time.

best
david

DaveW - August 19, 2015 Reply

I’ve traded mean reversion of stocks for many years and would say that the strategy is currently on life support and almost dead.

To paraphrase Mr. Varadi, most of the opportunities arise at the same time so it is really no better than trading a stock index for mean reversion.

The primary issue I have with your example test strategy is that a position is not exited until RSI(2) > 70. Theoretically, it would require an unlimited account balance to hold all of the open positions during an extended market drop. Since this is not possible (for most of us), I don’t think that the resulting statistics reflect the reality of trading a stock mean reversion system.

Cesar Alvarez - August 19, 2015 Reply

@DavidV: I will have to look into if stocks are all over-selling at the same time now more than they have been in the past.

@DaveW: My own mean reversion trading through the test period has the opposite results. Meaning through 6/30 my MR strategies were doing well. I will have to look into if all the trades are happening at the same time. This was not meant to be a trading strategy but a high level look at mean reversion. The minute you put it into a portfolio you get bias from position sizing, ranking, etc.

Quantocracy's Daily Wrap for 08/19/2015 | Quantocracy - August 19, 2015 Reply

[…] The Health of Stock Mean Reversion: Dead, Dying or Doing Just Fine [Alvarez Quant Trading] My second post on this blog was a look at mean reversion, Is mean reversion dead? Given I am using a new data provider(Premium Data), it has been almost two years since that post and there have been other articles on this recently, I figured it was time to check again. The research will focus on Russell 1000 stocks since 1995. The test is back to 1995 covers 3 bull markets and 2 bear ma […]

Shawn - August 20, 2015 Reply

Hi Cesar

Interesting results. Will you do something similar for momentum? Some of the same authors who recently claim mean reversion is dead also say the same thing for momentum.

Regards

Shawn

Bill - August 20, 2015 Reply

Hello,

(1) Why is the RSI(2) a mean-reversion algo?
(2) One cannot easily buy or sell at the close while using an RSI(2. It would be good to repeat the study with realistic next open.
(3) Your results are biased by data-snooping and knowledge of the trend. You will have to detrend the series to see if mean reversion, the way you define it, really works. Otherwise you must also include the short side. Apparently your results reflect the strong uptrend of the market and cannot be used to support mean reversion unless the series are properly detrended.
(4) Given the above, the results are biased and cannot support any claims unless all factors that enforce bias are removed.
(5) This is not quantitative analysis. If you want to see if markets are mean-reverting you have to use the ADF test https://www.quantstart.com/articles/Basics-of-Statistical-Mean-Reversion-Testing

Bill

Cesar Alvarez - August 20, 2015 Reply

@Shawn: Give me the rules you would like to test for momentum, and I could look into it.

MP - August 20, 2015 Reply

I think the best test is to look at per-trade returns relative to the dividend-adjusted index. Then check the std. deviation of those relative returns. That ratio (rel. ret./std. dev.) would be interesting to plot over time.

I.e., is this concept still beating the index, both in pure returns and in a risk-adjusted metric?

Also, it might be worth checking whether the most thinly traded members of the index are driving the returns.

MP - August 20, 2015 Reply

As a crude estimate, I calculated that the R1000 index returned an average of ~ +0.22% per 4.8 days in 2014. When you compare that to the +0.13% avg. return of the strategy (9 bps underperformance per trade), it looks like a pretty rough year.

IMHO BEST LINKS FROM QUANTOCRACY FOR THE WEEK 17 AUG 15 — 23 AUG 15 | Quantitative Investor Blog - August 21, 2015 Reply

[…] The Health of Stock Mean Reversion: Dead, Dying or Doing Just Fine […]

Cesar Alvarez - August 21, 2015 Reply

@Bill:
1 – RSI is a common indicator to use to determine if a stock is oversold or overbought. There are many other indicators that do the same thing.
2 – This is not meant as a trading strategy but as an investigation. But I never several traders that do trade at the close. One can calculate the closing price needed to exceed a RSI value
3- I have done this exact same research several time in the last decade. I wish I had the knowledge of the trend.I do like your idea of including the short side even though short strategies are rarely the inverse of the long version.
4&5 – Given your thoughts on this, I would suggest you ignore this post.

Cesar Alvarez - August 21, 2015 Reply

@MP: I like your idea of comparing the results. I would comparison to all stocks in the index. I would by every stock every day and hold say 5 bars. Then compare how this does to MR. I don’t think comparing to the index is the way to go because it favors the heavier weighted stocks.

Best Links of the Week | Quantocracy - August 22, 2015 Reply

[…] The Health of Stock Mean Reversion: Dead, Dying or Doing Just Fine [Alvarez Quant Trading] […]

Shawn - August 23, 2015 Reply

Hi Cesar

I hadnt really given an exact system alot of thought, sorry. I suppose anything momentum based should be fine. The ROC is a fairly standard staple of momentum systems. Maybe something with that? Or anything else you think might be interesting. Anyway, leave it up to you and your time 🙂

Regards

Shawn

    Cesar Alvarez - August 23, 2015 Reply

    @Shawn: I am going to do a follow up post. One of the stats I will be looking at is the performance of RSI2>95 stocks over five days.

The Health of Stock Mean Reversion: Dead, Dying or Doing Just Fine | SAMUELSSONS RAPPORT - August 23, 2015 Reply

[…] Källa: The Health of Stock Mean Reversion: Dead, Dying or Doing Just Fine | Alvarez Quant Trading […]

The Health of Stock Mean Reversion: Reader’s Ideas | Alvarez Quant Trading - September 16, 2015 Reply

[…] previous post The Health of Stock Mean Reversion: Dead, Dying or Doing Just Fine generated good reader’s suggestions on other ways to check on mean reversion health. Let us see […]

Leave a Reply: