
- in Mean Reversion , Research , Stocks by Cesar Alvarez
How is mean reversion doing? Dead, Shrinking or Doing Just Fine
A common question I get from readers is “does mean reversion still work?” The last time I wrote about this topic was in 2015, a long time ago, in the post “The Health of Stock Mean Reversion: Dead, Dying or Doing Just Fine” I did not realize it had been so long. Time to look at it again.
The Test
Date Range: 1/1/2001 to 12/31/2018
Entry:
- Stock is member of the Russell 3000
- Two period RSI crosses below 1
- As traded price is above $2
- Entry on next open
Exit:
- Two period RSI crosses above 70
- Exit on next open
A couple comments on the rules. I take all the signals and buy $1000 worth of the stock. I am not testing a portfolio. The test differs from the 2015 test because I believe this captures better what we are looking to discover. The $2 rule I added simply to stay away from very low-priced stocks that I do not trade and could distort the results.
All charts have a dotted trendline on them.
The Results
Number of trades.
The total is 88,750. The first question is are fewer stocks becoming oversold?
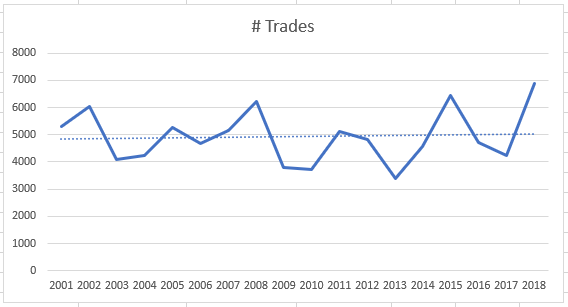
A very slight uptrend but staying around 5000 trades per year. Trades are not happening less frequently. That is good.
Average % profit/loss
What has been happening to average % profit/loss over the years? This I fully expected to go down.
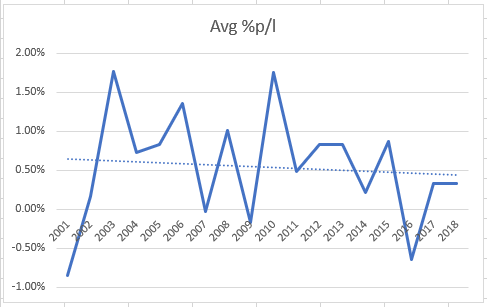
This was not a big surprise. The average % profit/loss over the entire time period is .52%. The last two years the average has been .33%.
Focusing on bull market years. From 2003 to 2007, the average is .89% vs .52% from 2010 to 2018. As more people trade mean reversion the smaller the edge gets.
Average Day Hold
Have the trades become shorter in length?
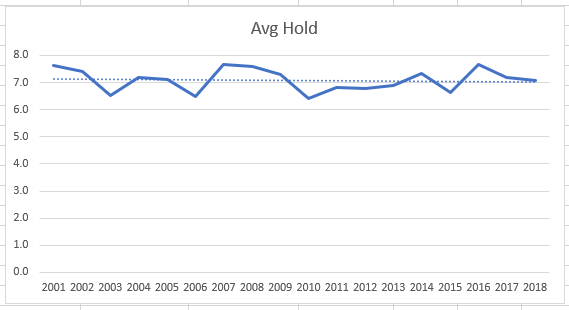
This one really surprised me because I thought they had from my own trading. But we can see that the hold length has stayed the same. A remarkable consistency.
100 Day Historical Volatility
Are stocks not as volatile? Is that why the average % profit/loss is smaller?
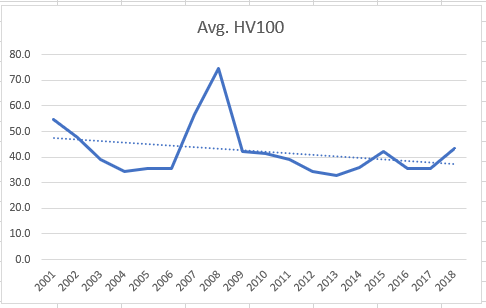
Looking at the bull market years we can see that there has not been a lot of change in volatility to trades taken. Again, another surprise as I was expecting a large decline.
Percent Winners
What is the win rate doing?
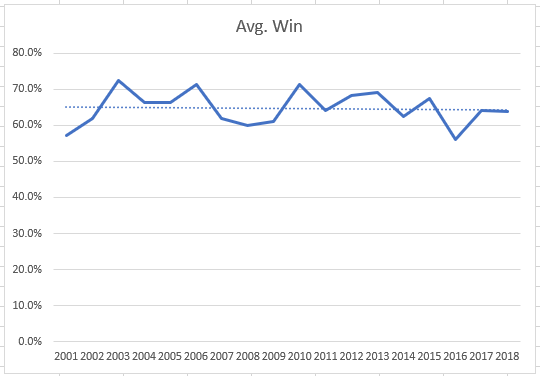
The % winning trades has stayed very consistent around 65%.
Using the MA200
I typically only trade mean reversion when the stock is above its 200-day moving average. Do the numbers change if I focus on those stocks? Unfortunately, the numbers tell the same story. Here is the Average % profit/loss for above the MA200.

Same general downtrend. I found it interesting that the last two years the returns above and below the MA200 have been about the same at .33%. The spreadsheet you can download also contains all the charts for above the MA200.
My Mean Reversion Strategies
I used to trade a ‘simple’ mean reversion strategy that did well until 2015. I stop trading it in 2016 because of poor performance and it has lost moneyin 2017 & 2018. At about the same time, I started trading a slightly more complicated mean reversion strategy. It has done well the last two years. Two more random data points.
Spreadsheet
Fill the form below to get the spreadsheet with the yearly numbers used to generate this data. This includes all the trades too. And lots of pretty charts.
Final Thoughts
I expected to find the following when I started this update
- Hold periods becoming shorter
- Volatility becoming less
- Average % profit/loss becoming less
But only one of these is true. My theory was that the first two were causing the smaller edges. At the end of the day I think too many people are following mean reversion trading. It is easy to test and see great performance overall but those edges are shrinking and getting harder to find. They will likely come back during the next bear market because mean reversion is hard to trade then. Current verdict: slowly shrinking.
Backtesting platform used: AmiBroker. Data provider: Norgate Data (referral link)
Good quant trading,

Fill in for free spreadsheet:
