
- in General , Mean Reversion by Cesar Alvarez
Trading rules that keep you trading
I have written the difficulty in trading and testing short strategies. I had stopped trading my short strategy because it was too hard to trade psychologically for me. About nine months ago, I revisited my short strategy to see how it had been doing since I stopped and of course it has been doing just fine even during these very bullish times.
As strategy developers we often add rules to improve some metric, for example CAR or Sharpe Ratio. But just as important are rules that will help you keep trading the strategy even if the rule worsens your metrics. That is the case of what I did with my short strategy. I added two new rules that made the results worse, but I believe will make it easier for me to trade in the future.
The Original Strategy
The original strategy trades Russell 3000 stocks and it is a typical mean reversion strategy. I will not be sharing the rules. Here are the results from 2007.
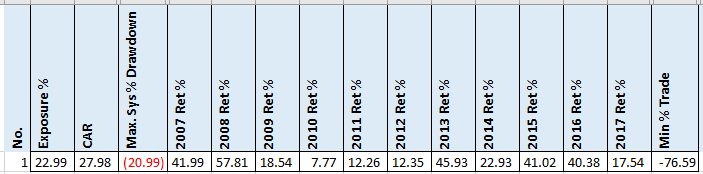
As you can see it has held up well during the bull market. But here is the problem with backtest reports they don’t show you the pain of the trades. As you can see the worst trade is -77% and that was held for 29 trading days. Holding a trade like that is psychologically hard to do. The third worst trade was down 53% over 21 days. Again, these are hard to handle and can cause one to stop trading. This caused me to abandon the strategy several years ago.
Max Loss Stop
I was discussing this strategy recently at a NWTTA meetup and of course the discussion came to stops. What if you simply exit when your end day loss is more than X%?
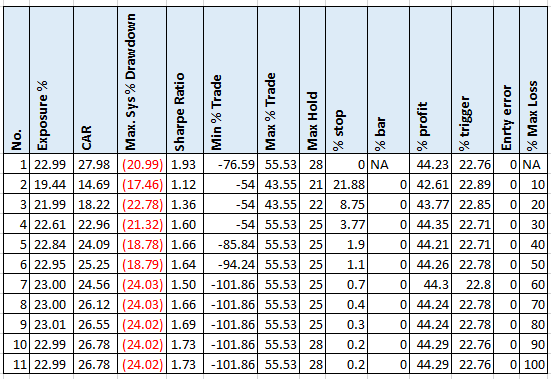
I just love this test. As you can see no matter what value you pick for your max loss stop your CAR and/or MDD is worse than without. A reasonable 10% stop cuts the CAR in half with 21.9% of trades triggering the stop. This is why I test. What I found funny is that even a 100% stop makes both numbers worse with .2% of the trades triggering the stop. I would not call a 100% stop a “real” stop.
I like the stops between 20 and 60 percent because they do not harm the results too much and get you out of bad trades. But there are two components to a bad trade, the time and the loss. This only tackles the loss.
Time based exits
One exit I like is time based exits. If a trade has not had an exit signals after N days, then exit it. This handles the other psychological part of bad trades where you see them day after day in your account.
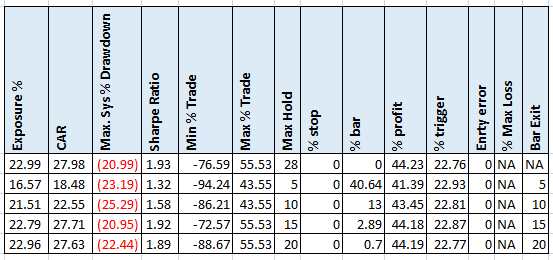
Again, we see a worse CAR and/OR MDD. I like the 15 day value with 2.9% of trades triggering it.
Combined Stop Loss and Time Based Exit
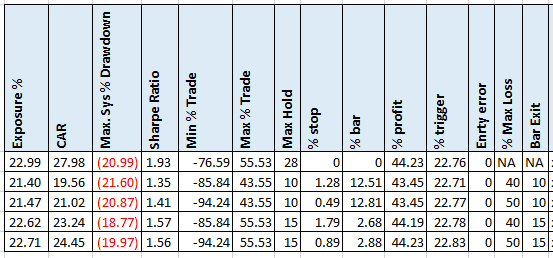
Looking at these combinations, I decided to trade the 50/15. This has a substantial drop in CAR. Also notice that the worst trade is substantially larger too. By not being in these long drawn out deep losers, I believe it will make the strategy easier to trade.
Spreadsheet
Fill the form below to get the spreadsheet with all the results and additional stats. See yearly breakdown and many more values for the stop and bar exit.
Final Thoughts
Even though adding a max loss stop and time based stops make the results worse, you might add them to your strategies. One of the biggest failures as systematic traders is stopping a strategy simply because of a couple of psychologically difficult trades. Besides these changes, I also reduced the amount allocated to this strategy. With these changes, I hope to deal with these loses better. Only time will tell.
Backtesting platform used: AmiBroker. Data provider: Norgate Data (referral link)
Good quant trading,

Fill in for free spreadsheet:
