May 23, 2018

Trading the Equity Curve – More Ideas

A couple posts ago, I looked at Trading the Equity Curve and found interesting results but nothing that made me decide this works for me. Using the equity curve to decide when to stop trading a strategy just sounds like it should work. But for me it is always about testing. I cannot count how often I thought an idea would help the results only to see them dramatically hurt them. Remember test everything!

I have been thinking about other methods to use to trade the curve. I also wondered maybe it is the strategies I tested against that caused less than stellar results. I am working on a SP500 weekly mean reversions strategy with an average hold of three months.  Maybe new methods of trading the curve or the different strategy will give better results.

The Strategy

No rules will be given. Here is the general concept. Buy S&P500 stock when it is a weekly pullback. Of course, there is a market timing filter to keep out of bad markets. Then exit with a profit target or maximum loss. These are the baseline results without trading the equity curve.

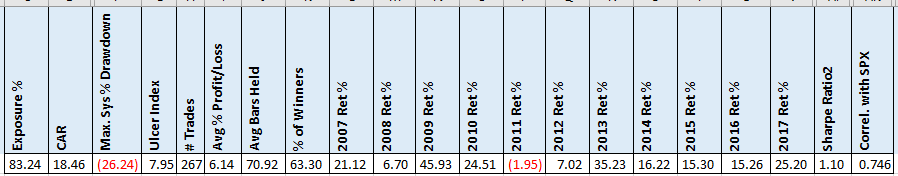
Clearly this strategy has not had problems. Now can we add trading the equity curve and not dramatically change the results for the worse?

The Methods

These are the methods I will test. If you have other ideas, put them in the comments below. If I get enough new ones, I will test them. The first two ideas are similar to what I tried on the previous post. The drawdown idea resonated with me and was curious to see how it would work out. The last rule I decided to simply try combing two rules that did well from last time.

  • The curve is above the (100,200) day moving average
  • The (50,100,200,252) day return is greater than zero, (ROC)
  • The current drawdown is less than (10,15,20,25)%
  • The 252 day return is greater than five percent
  • The 252 return is greater than 0 or the equity is above the 200 day moving average

When the equity curve test is not true, we stop taking new trades. Any currently open trades we simply exit as they normally would. When the equity curve test is true again, we can take trades

Results of Trading the Equity Curve

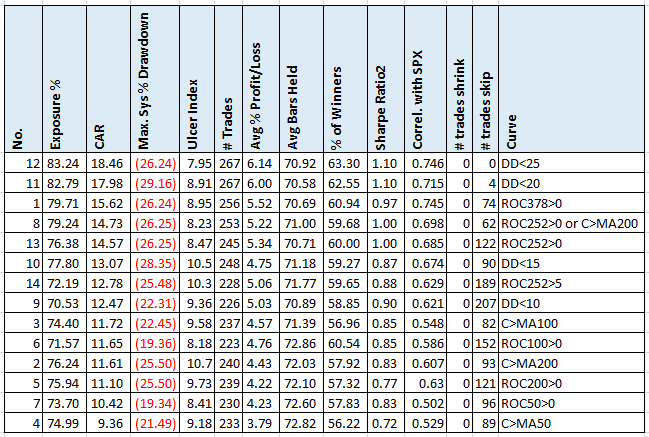
Two columns need explaining. # trades skip, is the number of trades the strategy did not take because of the equity curve rule. As you can see the top row missed no trades and this is basically the original strategy results. My goal is no more than a 10-15% reduction in CAR. At 15%, this cut off is 15.69, which only one version beats. This version, drawdown<20%, skipped only 4 trades. Too small of a sample size.

Rules Don’t Need to be Black or White

One thing I am bad at is having rules be black or white. In trading the equity curve rule, the rule either allows trades to happen or does not. One thing I have seen in lots of strategies is that they have a steep sell off and then have a quick bounce back up. I was wondering if the equity curve rule was getting us out and then not letting us enjoy the bounce back up.

Position Sizing Rule

My next idea was to shrink the position size depending on how long it has been since the rule was true. For example, our equity rule is ROC252>0. It has been 10 days since this has been true and the cutoff value is 50. Our allocation to the trade is

New allocation = Normal Allocation * (1- (days since equity rule true)/(rule cutoff)

New Allocation = (10%)*(1-10/50) = (10%)*(.8) = 8%

Each day the potential size shrinks. When it has been more days the cutoff value, then the strategy stops shrinking the trade and starts skipping trades.

Shrinking Position Sizing Results

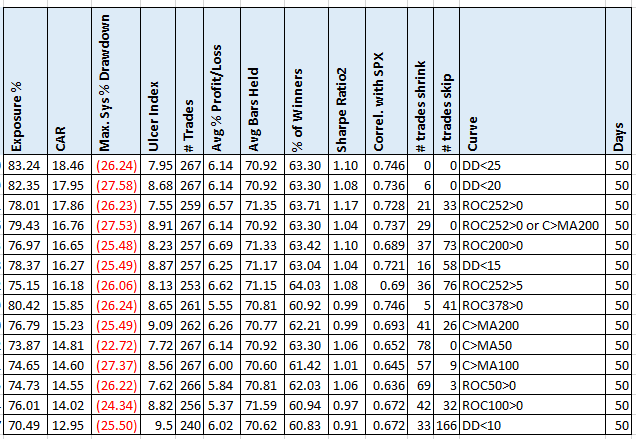
How we have several results with CAR greater than 15.69. Off these, I like the RO252>0 and DD<15. The MDD stays about the same which is good.
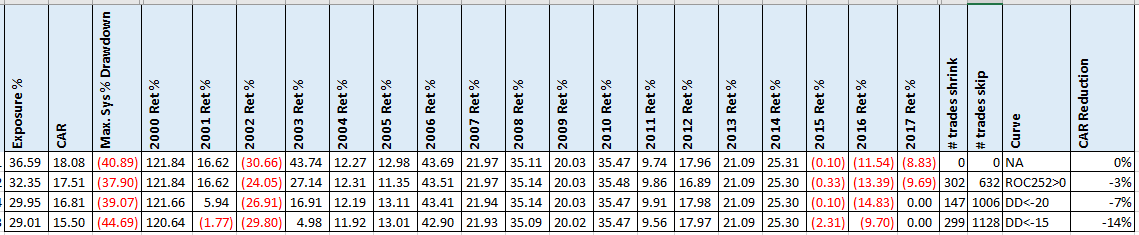
Broken Strategy

From the original post, I wanted to see how these methods would do. I also added DD<20 because this strategy is much more volatile

Click for larger image

The goods news is the CAR does not drop over 14% with these methods. The MDD stays about the same, which is good. The interesting part is looking at the 2016 & 2017 results. For the ROC252>0 method these two years are worse. The DD<20, gets you out for 2017 but did worse in 2016. Only the DD<15 method helped for those two years.

Spreadsheet

Fill the form below to get the spreadsheet with all the results and additional stats. I also ran with many more parameters for Days cutoff value.

Final Thoughts

I heard on a podcast that a quant trader was using the equity curve to decide when to stop trading. But it did not sound like they had tested it. Even though the idea sounds great, they may be dramatically reducing their results if their strategy continues to do well.

These methods can help you of a strategy but then comes the next question. How long do you give it before saying it is broken?

The position shrinking methods have produced good results without severely compromising the strategies. I must try these methods on my other strategies and see if they hold up. Remember test everything!

Backtesting platform used: AmiBroker. Data provider: Norgate Data (referral link)

Good quant trading,

Fill in for free spreadsheet:

spreadsheeticon


Click Here to Leave a Comment Below

Michael W Barrow - May 23, 2018 Reply

Cesar:

Interesting post. Thanks for sharing.

Here’s one thing that I do that is very simple and works much better for me than actually trading the equity curve per se, but it is based on a very similar concept: recent performance of the strategy potentially gives you information that you can use to improve the strategy.

First of all, I take all trades. The magic is in the position sizing. I look at the profitability of the last two trades. There are four combinations: WW, WL, LW, LL. I adjust the Risk Weight for the next trade between 0.5 and 1.5 for each of the four states, based on backtesting. To keep it simple, I use only three values: 1.0 (the default), 0.5 and 1.5.

I have found, almost across the board, that I can improve my strategy’s performance, as measured by profit factor, by 0.10 to 0.25 points, and I can usually have larger net profitability compared to the baseline strategy. I take all trades, so I don’t have to mess with code that simulates taking a trade and factoring it into a synthesized equity curve.

This is actually a modified version of what I started doing which was just looking at the last trade. What I found for most mean-reverting strategies (and many trend strategies) was that the trade results were also mean-reverting. So typically I would bet 1.5X after a loss and 0.5X after a win. Try this. It really works well, and I have found it to be robust in actual trading across a lot of strategies.

The reason I modified the approach from just looking at the last trade and instead using the last two trades was that I didn’t want to get into a death spiral with a broken strategy that just kept losing. Since I was betting 1.5X after each loss, I didn’t want to get into a situation where I had X losses in a row and was getting killed by exacerbating that with larger than normal sizing each time. So with monitoring the last two trades, I don’t allow the LL combination to be set to a risk weight greater than 1.0, and it would be ideal if it came in at 0.5 in the backtesting. The other three combinations (WW, WL and LW) each can go up to 1.5X, but not the LL combination. For most of my live strategies, I have found that limiting LL to no more than 1.0 has actually improved the profitability and stability of the equity curve.

What you also have to do with this approach is adjust how you use your system metrics because you might have a strategy that backtests with these as the optimal settings:

WW: 0.5
WL: 1.5
LW: 1.5
LL: 1.0

In this case, the sum of the four risk weights doesn’t add up to 4.0, so we are actually risking a little more money overall with these settings than if we were doing 4 X 1.0 for the baseline. So with more money at risk, I usually look at the profit factor rather than the net profit or average trade to gauge how performance compares to the baseline.

While I have not experienced that this approach is too curve-fitted, I’d be curious to hear if your gut/experience or your testing supports that conclusion or contradicts it.

It took me a while to trust this effect that I noticed when testing, but it was so consistent, especially with mean-reverting strategies, that I just went with it and then expanded on it. I like it. It’s pretty simple. It almost feels too simple. That’s probably why I still don’t trust it as much as I’d like, but I trust it enough to incorporate it as a component into all of my 75+ live strategies.

One reason I decided to start working along these lines was that I truly hate the hard decision that always comes with most indicators or trading approaches, and that is how many lookback trades or bars to use as an input parameter. I hate that, so I avoid it if I can. For me, comparing the equity curve to its moving average is just too complicated and too much work to code. I have also found in my testing that approach that the robustness just isn’t there when I try to optimize/test through different parameter settings for the number of trades to look back in the moving average.

Regards,
Michael

    Cesar Alvarez - May 23, 2018 Reply

    Thanks for the very interesting idea. Is it OK if I test this for a future post? The only issue I have is that this does not get you out of a broken strategy. But I like it as a position sizing approach.

Patrick Verhoeven - May 23, 2018 Reply

What about selling out of existing trades. ie Don’t let them follow their normal course.

    Cesar Alvarez - May 24, 2018 Reply

    I tried that. That tended to hurt the results even more than normal. I forgot to mention this in the post.

Matthew Wills - May 24, 2018 Reply

Hi Cesar and Michael,

I have tried this approach and found it to work quite well.

I struggled to get amibroker to do the backtest for me and so I have had to use MATLAB as a post processor of the trades / equity curve to test the results.

I found that a rolling window of the accuracy of the last 20 trades provided a good barometer. I would increase the position size slightly (say 25pct) when the accuracy dropped from the mean and reduce it by the same amount when the accuracy increased well above the mean.

My research supports the idea that equity curves of ‘mean reversion’ systems in particular, are themselves mean reverting.

As for the issue of getting out of a broken system, for what its worth I run a monteCarlo simulation using my out of sample test data to determine the 95th percentile of maxDrawDown with positionSize = $10000 / trade.
I then calculate the actual drawDown of my system using the same positionSizing. If the actual drawDown exceeds the 95th percentile. I have an automated kill switch in my trading robot that will either stop trading and send me an email, or I have it throttle the position size by 90%.

As soon as the drawDown moves back above that critical level the system goes back to normal position size.

I found that the most profitable time to trade was just after a market / system crash so its critically important to get back in there as soon as the system begins to recover; missing out on the rebound can leave you in drawDown territory for a much longer time otherwise.

Thanks very much for your research! I look forward to the next post.

Cheers
Matt

    Cesar Alvarez - May 24, 2018 Reply

    This is another vote for the position sizing idea. I will put this on the future post list. The issue I have you your MC method is that I believe that original testing needs to be done with it. You are correct that if the system is still working then you need to be there for the bounce.

Dirk Legahn - May 29, 2018 Reply

Thanks for the interesting research and posts on trading the equity curve.

I have some experience with this too.

First I tried to find an indicator based solution like Cesar. A 20/50 weekly SMA crossover works for most equity curves. But I didn’t feel too happy with this setup.

After this I experimented with personalized stops of every equity curve. This works fine, but this is a little bit curve fitting.

Finally I found that I don’t need equity curve trading! If you have some uncorrelated strategies, it’s better to select the top x systems for trading.
I use a monthly rotation and select by weekly ROC(26)/StdDev(26). Its very rare this model select a system which is normally off. The advantage of this approach is that the total equity curve has clearly better system ratios, I can focus my capital and I need less time for trading.

greetings from the Caribbean,
Dirk

    Cesar Alvarez - May 29, 2018 Reply

    I plan to give your last idea a try of trading the top X strategies. A future post.

Gerard Threels - June 3, 2018 Reply

Hi Cesar,

Perhaps you know the Market System Analyzer from Adaptrade Software.
This software can help to find optima for equity curve crossovers.
It’s not difficult to export Amibroker trades to MSA.

Please note that I’m not affiliated with the company.

Regards,
Gerard

    Cesar Alvarez - June 3, 2018 Reply

    Find the optimal values is not the problem. It is finding a method that works across the strategies and does not have a large performance hit.

SERGEY - March 17, 2019 Reply

I also had success with position adjusting approach, but instead using multipliers for position, i used step parameter. Really 2 parameters – one for decreasing positions on each bad trade, and one for increasing. Result is growing annual incocome 13% to 38% on some strategies. Also i have good expirience in using virtual equity curves for packet of strategies. Each strategy calcs virtual equity curve and generates some signal -1, 0, 1
Then i use following formulae to get real trade signal:
Sum((eq(now)-eq(month ago))*signal)/sum(eq(now)-eq(month ago)))
Here i mean sum of all strategies in pack
It also works

    Cesar Alvarez - March 18, 2019 Reply

    Interesting ideas. I will have to try them. How large do you let individual trades get? Can you explain the second idea about equity curves? I am not sure I fully understand. Thanks.

Leave a Reply: