- in General , Market Timing , Research by Cesar Alvarez
How to turn off a strategy using historical volatility
A very common question I get, is “when should I turn off a strategy?” Given the very volatile markets we have had the last few months, I can relate. Some strategies can thrive in these high volatility markets. While others can suffer.
In the June 2020 issue of Technical Analysis of Stocks and Commodities, Perry Kaufman writes an article about using the historical volatility of the equity curve to decide when to turn off a strategy. I always read Perry’s articles because they are full of good ideas and this was another one that I liked and had not tried before.
The Rules
Summary of rules as in the article.
- Keep track of the daily returns
- Calculate the 20-day historical volatility of your returns
- When volatility exceeds 30% and the return over the last three days is negative, exit all positions
- Restart the strategy when volatility falls below 30% and the return over the last three days is positive.
Each strategy will have a different volatility threshold which one must test for. He also suggests possible using different volatility values in steps 3 & 4 to reduce whipsaws.
I like this idea because it is simple and easy to test.
Optimization Parameters
Since he recommends finding the right values for each strategy, here are the parameters and values I tested.
- Volatility length (10 to 100 in steps of 10): VOL_LEN
- Volatility Cutoff (10 to 50 in steps of 2.5): CUTOFF
- Offset (0, 2.5, 5): OFFSET
- Return window days (1 to 9 in steps of 2). Also tested without this rule: ROC_LEN
Rules
Enter strategy when
VOL_LEN-day HV is less than CUTOFF and ROC_LEN-day return is positive
Exit Strategy
VOL_LEN-day HV is greater than (CUTOFF+OFFSET) and ROC_LEN-day return is negative
The Tests
I will be testing this on two strategies I trade. One is a momentum strategy with an average hold of six weeks. The other is a mean reversion strategy with an average hold of 5 days. I wanted to test two very different strategies because I did not know if this method would work better on one than the other.
The initial test dates are 1/1/2007 to 12/31/2019. I will use these dates to see how much improvement I get on the strategy with the focus being on compounded growth rate (CAR) and maximum drawdown (MDD). I will then pick parameters and test through 5/31/2020 to see how much they would have helped this year.
In the tables below, ‘Base’ refers to the initial strategy before applying the concept.
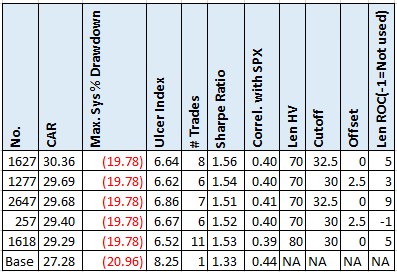
Momentum Strategy Results
Here we see about a 10% improvement in CAR with a 6% improvement in MDD. The Sharpe Ratio takes a 15% jump. One issue I have is the small number of times this triggers.
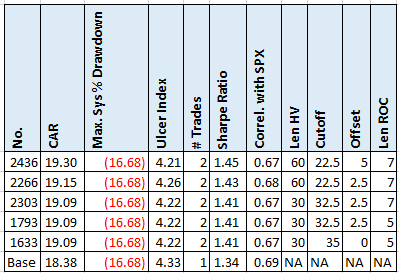
Mean Reversion Strategy Results
Again, we improvements in CAR & Sharpe but smaller and with fewer signals.
No Market Timing
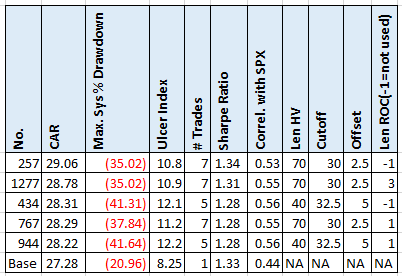
Both the above strategies use a market timing rule. Which in a sense this type of rule is. What would happen if I removed the market timing rule? Let’s see how that works on the momentum strategy.
The CAR came down a little but the MDD jumped up a lot. No help there.
Momentum Strategy through June 16, 2020
I picked the 5th best run from the optimization because it was the first with greater than 9 trades. I then ran that through June 16, 2020, to see how it would have done during the meltdown and melt-up.
Using those parameters, a signal to exit occurred on March 5th. Quite early into the meltdown which is good.
But what about the melt-up? It is still sitting out. The reason being that the 80-day HV is at 41 while the entry HV is 30.
Without using this volatility filter, the strategy went to cash because of market timing on March 23 and got back in on May 27. The volatility filter deep dampens the volatility during the selloff but it would be hard to be still sitting around in cash.
Spreadsheet
No spreadsheet with this post.
Final Thoughts
I really liked the idea of using the volatility of the equity curve to decide when to stop trading but the testing results did not have a large enough impact for me to add it to my trading for these strategies. It could be because of the type of strategies. I will try this on the other strategies that I trade.
One big concern I do have is that it adds four more variables that must be determined for each strategy. This gives more opportunities to overfit the data.
Backtesting platform used: AmiBroker. Data provider: Norgate Data (referral link)
Good quant trading,


