
- in Stocks , Trend Following by Cesar Alvarez
S&P 500 Dividend Aristocrats
Back in 2018, I wrote a post, Backtesting a Dividend Strategy, which was conceptually based on the S&P 500 Dividend Aristocrats. Just recently, Norgate Data started offering historical constituent data for the S&P 500 Dividend Aristocrats index. This would be a much ‘cleaner’ version compared to what I was trying to do in my original post. Would using this index produces better results?
Universe Size
My first question was how many stocks are in the index?
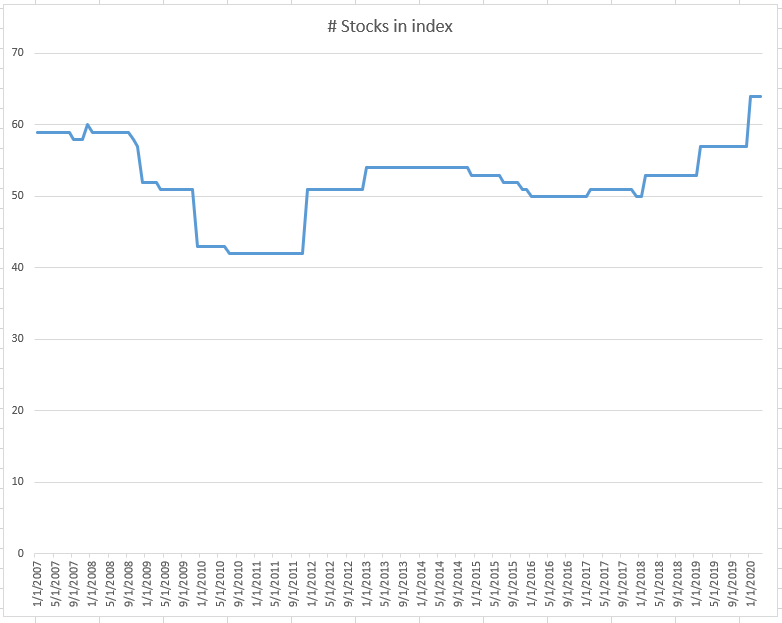
As you can see this is a small index with the number of stocks varying between 40 and 65. Few stocks have a rising dividend history.
Misc.
First, the first test is from 1/1/2007 to 8/31/2018 as in the original post.
Buy Rules
- It is the last trading day of the month
- Stock is a member of the S&P500 Dividend Aristocrats index
- Stock is above the 200-day moving average. Also tested without this rule
- SPX is above the 200-day moving average. Also tested without this rule
- Buy on the next open
Ranking
Below are the raking methods. Some of these are new from the previous post. Buy the top 10 ranked stocks by the method below.
- Highest above 200-day moving average (MA200)
- Highest Dividend Yield
- Highest 100-day historical volatility
- Highest 1 Month Return
- Highest 3 Month Return
- Highest 6 Month Return
- Highest 12 Month Return
- Highest Sharpe Ratio 6 Month
- Highest Sharpe Ratio 12 month
- Lowest 100-day historical volatility
Sell Rules
- If the stock is removed from the index, sell the next day
- At the end of the month, sell if stock under MA200. Also tested without this rule
- At the end of the month, sell if $SPX under MA200. Also tested without this rule
- At the end of the year sell all positions on next open
Results: Using SPX MA200
These results are from using the optional rule that the SPX is above the MA200. These are not using the stock’s MA200.
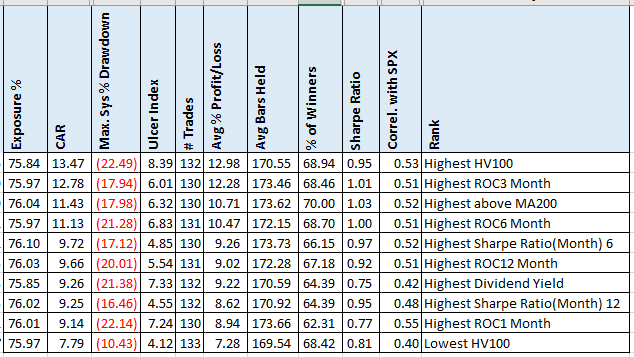
Comparing these results to the original post, the CAR is about 10% lower and the maximum drawdown is about 20% lower. Not the most stellar results.
Results January 1, 2020 to March 31, 2020
How did these stocks hold up during the market meltdown? Did the dividend provide a cushion? I took off the market timing filter.
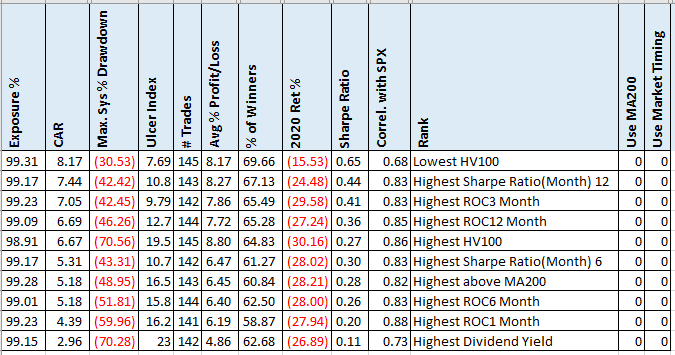
The $SPX was down 20% during this time period, while these variations were down between 15% and 30%. Only one of them had better results. The dividend did not protect these to the downside.
Focusing on the highest yielding stocks gave the worst results.
The S&P 500 Dividend Aristocrats Total Return Index has a CAR of 8.46 and a maximum drawdown of 49% during this same time period. The index return for 2020 is -22%.
Spreadsheet
Fill in the form below to get the spreadsheet with lots of additional information. See the results of all variations from the optimization run. This includes top drawdowns, trade statistics and more.
Final Thoughts
These results were not that different from my previous post. Those looking for consistent dividend stocks now have it easier with the new data. But creating a strategy that outperforms the Aristocrat index is not so easy.
I have heard over the years that “the dividend” will help protect the stock on a downturn in the market. In 2020, the dividend seemed to hurt. In my next post, I will look closer into this idea to see if it can help or does it always hurt as it did this year?
Backtesting platform used: AmiBroker. Data provider: Norgate Data (referral link)
Good quant trading,

Fill in for free spreadsheet:
