- in Rotation , Stocks by Cesar Alvarez
More ideas for ranking methods on a monthly S&P500 Stock Rotation Strategy
My last post on Different ranking methods for a monthly S&P500 Stock Rotation Strategy generated lots of emails on other ideas to try. Below are the results of these ideas
Base Rules
Backtest from 1/1/2007-12/31/2020.
Buy
- It is the last trading day of the month
- Stock is a member of the S&P500 index
- Stock is above the 200-day moving average (spreadsheet has results without this rule)
- The $SPX is above the 200-day moving average
- Rank stocks by one of the methods
- Buy the 10 highest ranked stocks (spreadsheet has results using 5 highest)
- Enter at the open on the next trading day
Sell
- Sell all stocks on the open of the first trading day of the month
Best results from the original post
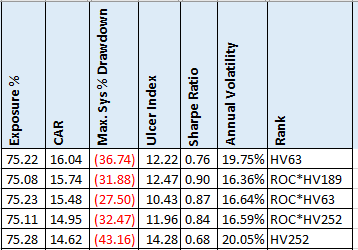
These are the top 5 results by CAR.
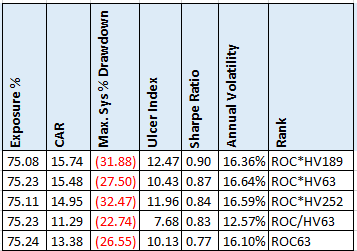
Next is the top 5 by Sharpe Ratio.
This is what we will be comparing against. For details on the above ranking methods, see the original post
Closing Price
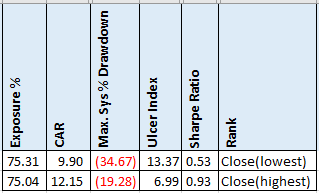
This was the most popular suggestion. Either trade the highest price or the lowest price. I used Norgate’s original price function which gives the price as traded before splits and dividends.
As in a previous post on using price, The Simplest Momentum Indicator, the highest worked better. As simple as this is, it does not make it into the top 5 for CAR. But notice that very low drawdown as compared to the original ones. So much lower that it has the best Sharpe Ratio.
ATR%
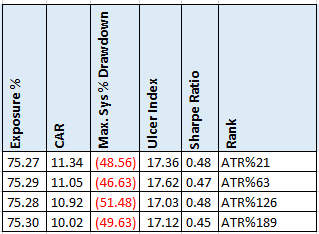
Using ATR another common theme. ATR% is ATR/Close. This is another way of looking at volatility
Given this is another measure of volatility, I was surprised at how poorly this did.
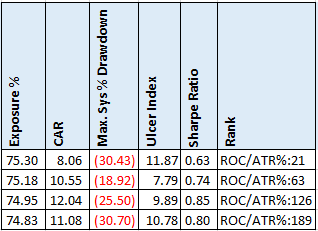
ROC/ATR%
This is N-day ROC divided by the n-day ATR%.
Using CAR as our metric does not produce interesting results. But two of these have Sharpe Ratios in the top 5.
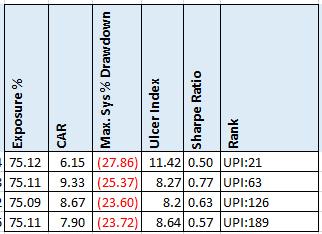
UPI
Now we get into the more interesting ones. The first is the n-day Ulcer Performance Index.
Nothing good here in terms of CAR or Sharpe Ratio.
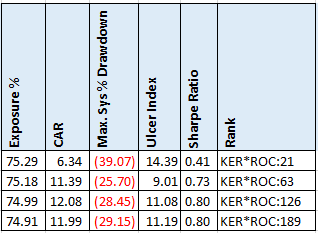
Kaufman Efficiency Ratio * ROC
The Kaufman Efficiency Ratio is ratio ranges between 0 and 1 with higher values representing a more efficient or trending market. This is the first time I have used this metric.
Not the highest CARs but two of these have high Sharpe Ratios.
Spreadsheet
Fill in the form below to get the spreadsheet with lots of additional information. See the results of all variations from the optimization run. This includes top drawdowns, trade statistics and more.
Final Thoughts
When a ranking method does not produce good results, I will often invert it to see how that performs. I did that in several of the ideas above but they often produced about the same or worse results.
I would say that most of these methods did not produce any good results. A few had potential like High Close or ROC/ATR% or Kaufman Efficiency Ratio * ROC. But these results were not as good as ROC*HV.
I will have to investigate the Kaufman Efficiency Ratio more and understand it better to see if I can use it in my trading.
Other blog posts on rotational strategies: Monthly S&P500 Stock Rotation Strategy and S&P500 Monthly Rotation-Readers’ Ideas
Backtesting platform used: AmiBroker. Data provider: Norgate Data (referral link)
Good quant trading,

Fill in for free spreadsheet:
![]()

