September 25, 2019

The Simplest Momentum Indicator

We all have our favorite momentum indicators. One of mine is percent off 1 year high. This requires 252 data points and comparisons, plus a division. Another one is the 200-day moving average. This requires 200 closing prices, 199 additions and a division. A simple momentum indicator is Rate of Change which is the return of the asset of the last N days. This requires two prices and a division to calculate. That is simple. In this post I will show one that requires just one price and no math.

In my last post, Monthly Rotation – Closeness to $10, while investigating the results I discovered that the higher priced stocks seemed to get better results. That got me thinking. Could simply ranking by the highest priced stocks work? It makes some sense. Price going up is what we want. Also, stocks don’t seem to split as often now days as they used. It seems to be a badge of honor to have a high-priced stock. Look at Amazon, Apple, Netflix and many more.

The Rules

Test date range 1/1/2007 to 7/31/2019.

Buy Rules

  • It is the last day of the month
  • Stock is member of the Nasdaq 100. I test several others.
  • Close is above the 200-day moving average
  • The close of the $SPX is above the 200-day moving average
  • Buy the top 10 highest priced stocks on the next open

The price I am using is the as traded price. This is the price before it has been adjusted for splits and dividends. This is the price you would have seen on your screen at the end of the day.

I am looking for up trending stocks in an up trending market.

Sell Rules

  • It is the last day of the month
  • Sell on the next open

Rank Testing

When testing a ranking method, I like to test in both directions. This lets me see if there is anything to the method. We want to see ranking by highest price to do well and lowest price to do poorly

If the ranking method is not good, then those two rankings will produce similar results.

Nasdaq 100 – A Winner

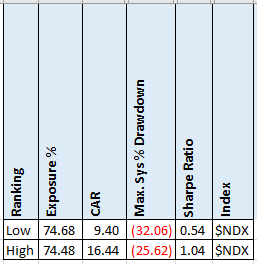
Wow these results are better than expected. From the previous post where I did random ranking, the CAR was 10.10 with a standard deviation of 1.86. The Low Price ranking is .4 SDs away. Not that good but below the average.

The High Price ranking is 3.4 SDs away which is good. I like seeing this number over 3 at least and prefer 4.

The Maximum Drawdown is also substantially lower which is good.

As a very simple ranking method, this does surprisingly well.

What about other indexes?

S&P500

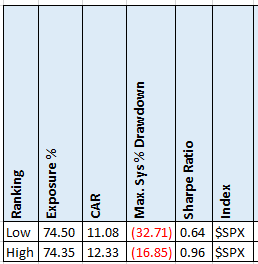
The results are not as pronounced here but the same pattern holds. I have not done a random ranking test on the S&P500 but the CAR results are too close for my liking. The MDD though is dramatically different. Could the lack of results be because of how the index is created?

Russell 3000

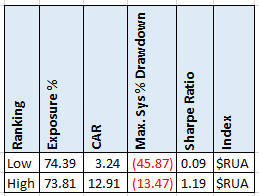
A definite clear difference here in the ranking. I cannot believe that the MDD is so low. I tested a MA200 on the $RUA index to see what those results look like. I got a CAR of 7.79 with a MDD of 19.13. Much better than trading the index.

OEX, RUI and RUT

I also tested these and the same pattern holds. Ranking by high price produces higher CAR with lower MDD than ranking with lower price. You can find these results in the spreadsheet.

Spreadsheet

Fill the form below to get the spreadsheet with lots of additional information. See the results of all variations from the optimization run. This includes top drawdowns, trade statistics and more.

Results also for the OEX, RUI and RUT.

Final Thoughts

Would I trade this system as is? No. Two reasons. The results are not good enough. Also, a stock may exit simply because it had a stock split even though it is still doing great. That bothers me some.

But using price as a ranking filter is something I must see if I can incorporate into some of my existing strategies or into new ones.

I would also like to do random ranking on each index to see how good the results are.

At the end of the day, that is one simple indicator.


Backtesting platform used: AmiBroker. Data provider: Norgate Data (referral link)

Good quant trading,

Fill in for free spreadsheet:

spreadsheeticon


Click Here to Leave a Comment Below

Bing - September 26, 2019 Reply

Thats interesting… who would have thought that selecting higher priced stocks could result in better performance. I wonder if this persists for shorter term mean reversion systems, even all the way down to day trades.

    Cesar Alvarez - September 26, 2019 Reply

    Testing on a short-term MR strategy would be interesting. May do that in the future to extend this post.

Enrique Romualdez - October 9, 2019 Reply

Love this post – very interesting. I appreciate your methods of validation as well; they make me very skeptical of the results I see in my own tests.

    Cesar Alvarez - October 9, 2019 Reply

    I am always skeptical of my own results. It is good to be paranoid.

Rick - October 27, 2019 Reply

Hi, interesting article! Questions-

Did you include commissions and slippage? The open is not ideal price to trade.

Does the system trade the actual price or used it only to rank stocks?

Did you handle constituent delisting in backtest?

Thanks!

    Cesar Alvarez - October 27, 2019 Reply

    The test includes $.01/share for commissions. The system trades the adjusted price and only uses the actual price for ranking. The test is survivorship bias and pre-inclusion bias free. Meaning I have delisted stock data and that I know the constituent data for the past.

Aristotle - November 2, 2019 Reply

You can get better CAGR by using a 252 day momentum lookback

    Cesar Alvarez - November 3, 2019 Reply

    Thank you for that information.

Rick - November 4, 2019 Reply

Hi, I replied here previously and asked you to check 16.44% CAR for possibility of error. I contacted some quants and at least one replied to me that it is not right according to him. Others did not want to even respond thinking it is ridiculously high. Are you willing to reply here and confirm that you checked this again and it is correct?

    Cesar Alvarez - November 4, 2019 Reply

    I do not see where in your Oct 27 comment that you asked for me to confirm the results. It is always possible that I made a mistake in the code. Give me a couple of days to double check the code and results.

      Cesar Alvarez - November 5, 2019 Reply

      First I doubled checked my code and it all still looked good to me. Know that there was still a possibility of an error in the code, I decided to ask a favor of a fellow researcher. Given the rules in the blog post, he was able to get the same numbers. At this point I can say I am very confident in the numbers.

Rick - November 6, 2019 Reply

Hi Cesar. Thank you for checking into this. I find close to 16.5% CAR for current constituents with your exact system. One way to remove the doubt is to add the Amibroker code at the end of article so anyone who has that program can check the results. If you are not willing to do that then maybe the Amibroker trades results excel file. The fellow researcher may be committing the same error if there is actually one. Delisting taken into account and 16.44% sounds too high.

    Cesar Alvarez - November 7, 2019 Reply

    I do not provide AMiBroker code. Having another professional researcher replicating the results is good enough for me. At this point, I see the following possibilities:
    * You find someone to code this up. If their results do not match, provide me with a trade list and their data provider.
    * You can purchase the code from me
    * I find a third professional to code this up. If they get the same results would this be good enough? They could make the same “mistake.”

    Am I 100% sure that the code is correct? No. That is never the case. Am I over 95% sure? Yes.

    To me, these results have been verified and are correct.

Rick - November 7, 2019 Reply

Hi Cesar. I suppose you are also interested in knowing whether there is an error.

I tested current index constituent for NDX and found 16.5% CAR in the backtest period for your exact system. Obviously with delistings the number should be much lower. Then I asked someone that has the delistings and reply was that your reported CAGR is too high. So let us take this from start:

1. What CAR and MDD do you find for current NDX index constituents only? Everyone should be able to confirm this in any platform.
2. What position size method do you use?

Thanks

    Cesar Alvarez - November 11, 2019 Reply

    I sent you email on this. I figure it is easier to discuss over email and then put the final results here.

Wade - November 19, 2021 Reply

Very, very interesting. I think what the NASDAQ 100 test is really showing is the massive outperformance of the Tech sector over the last 20 years. One thing I’ve learned managing money for a quite a while (investing, not trading) is that being in the right sectors (and avoiding the wrong ones) is one of the greatest factors for performance. The SPX includes Tech but clearly not as much as the NDX. The data are clear but I would be careful using high price as a long term factor because of the tilt towards a single sector. If you could test this in a sector neutral manner (much tougher to program) and get a similar result then you could be more confident. Or test the relative improvement of the high price factor across each individual sector to see how consistent it is.

Great work! Thanks for sharing.

Stefan - May 21, 2023 Reply

Hello Cesar,
at first: Thank you for your Artikels and hour Homepage, i have alredy learnd a lot. And thank you for your books. There are some of the beste Strategy Quant books out there.

Now i try to reprogramming this Signal Idea in AMibroker but i cant do it with my developing Framework, so i rewrite it as simple as possible, but i still fail.

Can someone help me to find my mistake ?

Pad and align is in Amibroker aktivate.
I get the un-adjusted Prices from the Norgate Database.
In AMibroker S&P500 current & Past is selected.
Time to Date is Correct….

——————————————————————————
#include_once “Formulas\Norgate Data\Norgate Data Functions.afl”

SetTradeDelays(1,1, 1, 1);

SetOption( “InitialEquity”, 100000 );
SetOption( “CommissionMode”, 1 );
SetOption( “CommissionAmount”, 0.25 );
SetOption( “MaxOpenPositions”, 10 );
SetPositionSize(100 / 10, spsPercentOfEquity);

SetForeign(“$SPX”);
ForFilter1 = C>MA(C,200) ;
RestorePriceArrays() ;

Rank =C;
PositionScore = Rank;

Buy= Month()!=Ref(Month(),1) AND
NorgateIndexConstituentTimeSeries(“$SPX”) and
C>MA(C,200) and
ForFilter1;

Sell = Month()!=Ref(Month(),1) ;

BuyPrice = ShortPrice = o;
SellPrice = CoverPrice =o;
—————————————————————————

CAR: -2.37 MDD:46.20 Trades 1130

Leave a Reply: