- in Mean Reversion , Research , Stocks by Cesar Alvarez
Multi-day Limits for Mean Reversion
A reader recently suggested leaving the limit orders for a mean reversion trade on for a couple of days. Typically, these orders are good only for one day unless the stock sets up again. I did not think that this would help but as I always tell my consulting clients when they ask me if an idea will work or not, “I am always surprised but what works and what doesn’t, so I test everything and let the numbers decide.” My expectation would be higher exposure but will this lead to higher returns?
The Concept
In the typical mean reversion tests that I do, a stock has a pullback. Then on the next trading day, a limit order is placed X% below the previous close. This order is good for a day only.
The change is that the limit order is placed and left there for N days. This is now giving the stock a couple extra days to have the selloff.
Complications
Originally, I thought this would be quick and easy to do. But once I dived into the code, I realized a couple of subtle points. For example, we give the stock 5 days to hit the limit price. But what if before the 5th day, the stock reaches what would have been the exit signal. It makes sense, that we no longer want to enter the position.
Do old signals take precedent over new ones? Or new ones over old ones? I resolved this issue by instead ranking all signals by the 100-day historical volatility. I did not care if it was a new one or an old one.
The Strategy
Test dates 1/1/2007 to 6/30/2021.
I wanted a very simple mean reversion strategy to compare the entries. I did not care about how good the strategy was because I want to see how the entries would change the results.
Setup
- Stock is or was a member of the Russell 3000
- The original close is above $1
- The 20-day moving average of the Close times Volume is above $500,000
- The $SPX is above the 200-day moving average
- The stock is above the 200-day moving average
- The 2-period RSI is under 5
Entry
- Maximum 10 positions
- Enter on limit order 3.5% below the close. Keep this order working for [1 to 5 step 1] days. If while the order is working, 2-period RSI closes greater than 70, stop the order.
- The number of orders to place is assuming all get filled will be 100% invested. No leverage.
- Rank stocks from high to low using 100-day historical volatility
Exit
- 2-period RSI greater than 70
- Exit on the next open
Results
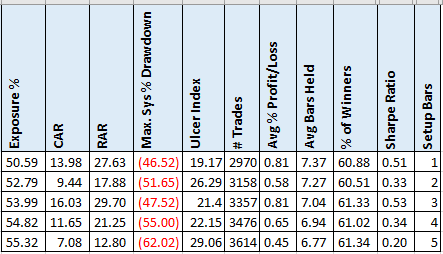
Well, these are messy-looking results. The first line is the original strategy where the limit is only good for one day.
As expected, the exposure went up. The CAR goes down then up then down and down. They generally are getting worse. The same pattern is holding for the Avg %p/l.
The results for the 3 days looked really off. I wondered if there were a couple of trades that did really well that skewed the results. After reviewing them, nothing jumped out at me.
A Second Mean-Reversion Strategy
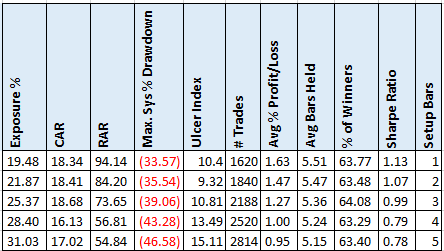
Given the above results, I tried this concept on a mean-reversion strategy I trade.
Again, exposure goes up as expected but CAR changes little. Though MDD does go up and avg % p/l goes down.
Spreadsheet
Fill in the form below to get the spreadsheet with lots of additional information. See the results of all variations from the optimization run. This includes top drawdowns, trade statistics and more.
Final Thoughts
As interesting as this idea was, it clearly does not improve the results. Unless one is looking for more trades for excitement, this is not something I would add to your trading arsenal.
Even though this did not work, I always test ideas. You just never know what will work.
Backtesting platform used: AmiBroker. Data provider: Norgate Data (referral link)
Good quant trading,

Fill in for free spreadsheet:
![]()


