December 1, 2014

SPX breaks record of closing above five day moving average

How strong is this market? The SP-500 index had closed above its five day moving average for 29 days and on Friday it finally closed below it. The last day it closed under the five day moving average was on October 16, 2014. This is the longest streak since 1963 (that is as far back as my data goes). The old record was 26 days in 1986. The previous best streak in the last decade was 19, which has been crushed. The index has not had a short-term pullback in the last month which is tough for a short-term mean reversion trader.

The question that always follows is what happens when the streak is broken. We will see what happens if one enters at the close the day the streak is broken and then exit 5 days, 1 month, 3 months and 6 months later.

Continue reading

November 19, 2014

Heikin-Ashi Charts

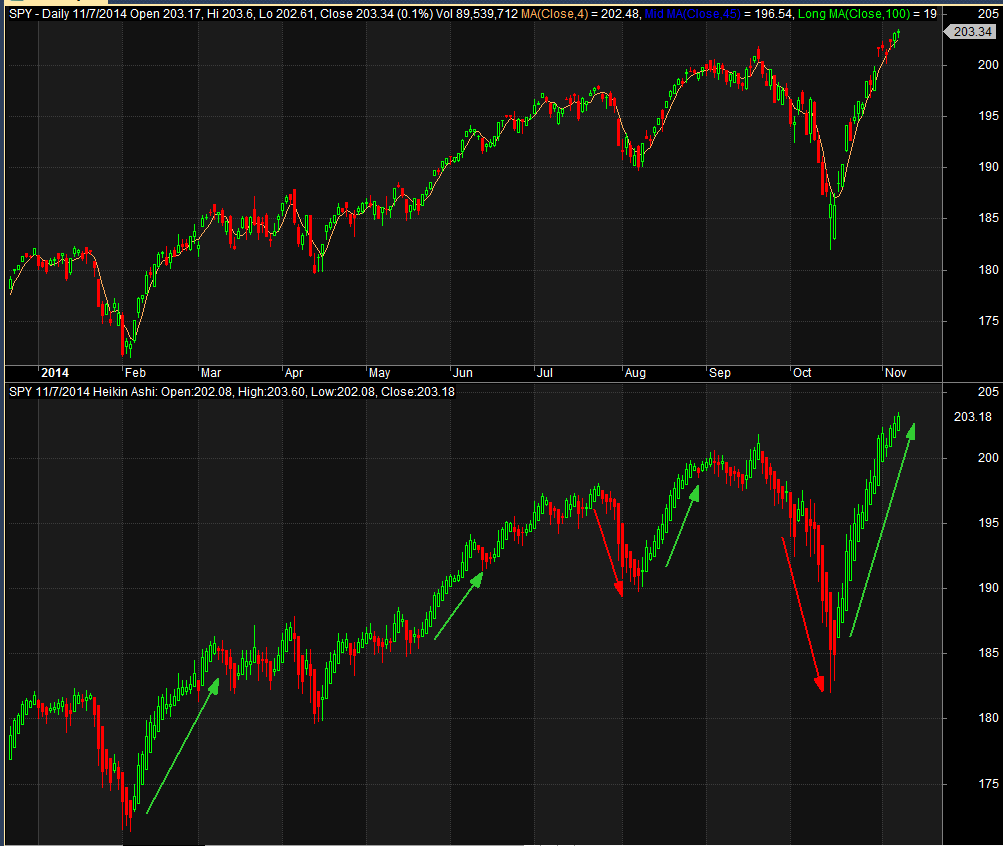
A reader recently introduced me to Heikin-Ashi charts. Popular with forex traders for showing trends which at first look of chart sure seems that way. Look at these two daily charts. The top one is a standard Candlestick chart while the bottom is Heikin-Ashi chart.

141119A

The trend of unbroken green sure seems more obvious and stronger in the Heikin-Ashi chart. Will testing confirm this?

Continue reading

October 22, 2014

To dividend adjust or not to dividend adjust? That is the question.

About once a month, someone asks how important it is to have dividend adjusted data. Or someone will comment they do not want to use Norgate Data because they do not adjust for dividends (it does but it is not enabled by default). My answer has been “without dividend adjusted data, your results may be understated.” It has always bothered me that I could not give a better answer. In my post, “How much does not having survivorship free data change test results?” I covered other data issues but not this one. Since Norgate Data makes it easy to have two databases, one with the dividend adjustments and one without, it was time to run tests and determine how much of a difference it makes.

Continue reading

October 6, 2014

What I am reading: 10/6/2014

Recent articles that I found interesting and made me think.

Learn Math or Get Left Behind

Every now and again, events occur that cause me to shake my head in dismay at people’s math skills. When the weather forecast is a 90 percent chance of a sunshine, and it rains, that doesn’t mean the forecast was wrong; rather, it was one of those cases where the low probability event occurred. Some people seem to believe that 90 percent and 100 percent are the same. Obviously, they are not.


Recall model assumptions before jumping to conclusions

I have written numerous times in this space about the importance of examining your assumptions before taking any action on quantitative research.


Advantages With Mechanical Strategies

A lot of the best traders (at least the ones I know) use some kind of mechanical rules in their trading. “Mechanical” implies that the rules are based on some kind of objective rules, usually quantified data. The trader should follow these rules exactly without hesitation or emotion. In this respect mechanical trading is the complete opposite of discretionary trading.


The Success Equation: Untangling Skill and Luck in Business, Sports, and Investing

In most domains of life, skill and luck seem hopelessly entangled. Different levels of skill and varying degrees of good and bad luck are the realities that shape our lives—yet few of us are adept at accurately distinguishing between the two. Imagine what we could accomplish if we were able to tease out these two threads, examine them, and use the resulting knowledge to make better decisions.


September 22, 2014

DTAYS Weekly Breakout Strategy With Time Stops

I recently read on Don’t Talk About your Stocks about an idea that stocks that were losers after (4, 6, 8) weeks should be sold to make way for other stocks that may do better. Will this idea improve the results from the original DTAYS Weekly Breakout Strategy? This reminded me of research I did while working for Larry Connors. On a mean reversion strategy we were researching, we noticed that after 10 days, 95% of the positions end up being losers. Then came the ‘obvious’ rule to add. Exit a position if it had not bounced after 10 days. We both thought this would greatly improve the results. It did the opposite and hurt them. Why? Because it was better to wait for the bounce even if the trade was a loser.

Continue reading

August 25, 2014

What I am reading: 8/25/2014

Recent articles that I found interesting and made me think.


VIX-Adjusted Momentum

The addition of many small details can make a big difference in seemingly simple strategies. I often like to use cooking analogies, and so I like to think of tomato sauce as a classic example: it contains few ingredients and is simple to make but difficult to master without understanding the interaction between components. Trend-following strategies are no different: anyone can create a simple strategy, few can master the nuances.


Do Risk-Adjusted Returns Matter?

The firm’s latest piece looks at smart beta and a host of factor investing data. One factor they looked into was the small cap anomaly. Past research has shown that small cap stocks have outperformed large cap stocks over longer time frames. Research Affiliates determined that this actually isn’t the case:


The Remarkable Truth about 52-Week High Stocks

On Wall Street, there are many highly publicized metrics that can trigger an emotional response in investors. The “52-week high” signal is a great example. It is a widely reported (e.g., Barron’s, WSJ, MarketWatch) and easily noticed statistic. Stocks at 52-week highs are at their peak versus historical values, and this is, presumably, valuable information. Also, peaks per se are salient, almost by definition, and so we tend to pay a lot of attention to them.


The Market Has Not Seen a Strong Up Day for Longer Than It Has Not Seen a Strong Down Day

Older post. We have recently seen the 2% down day but not a 2% up day.

It is a fact that the S&P 500 hasn’t had a -2% drop in the last 68 days but it also hasn’t had a 2% rise for 193 days. The market has given bears plenty of room to escape.


Frustrated by not being to test your own trading ideas? My AmiBroker & Backtesting 101 course starts in 2 weeks and there is still space left.. Click here to find out more.


Enjoy,

Cesar

Simple Ideas for a Mean Reversion Strategy with Good Results

A reader sent me some trading rules he got from a newsletter from Nick Radge. He wanted to know if these rules really did as well as published in the newsletter. They seemed too simple to produce such good results. This is a basic mean reversion or pullback strategy. The strategy as presented was long and short and went on margin but he wanted to know how it did the long only since he did not short. After contacting Nick Radge at The Chartist, I confirmed with him it was OK to publish these rules.

Continue reading