February 14, 2018

Trading the Equity Curve

A popular method for determining if a strategy should be kept trading is trading the equity curve. What this means we apply an indicator, say 200-day moving average, to the equity curve. When the equity curve falls below this value we stop trading. We then continue to paper trade the strategy until it gets above the moving average and then trade it live again. The general idea being that you get out when the strategy is doing poorly and get back in when it is doing well. Also once a strategy breaks, this gives you a simple way of getting out of it.

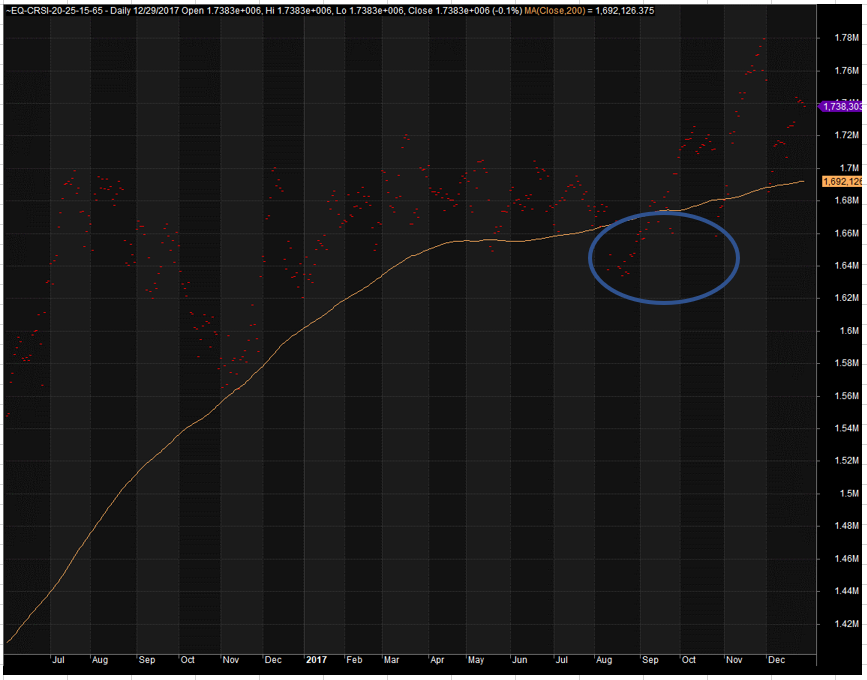
In this example we would stop trading during the blue oval because the equity curve is below the moving average.

Often people will pick an indicator to use and then trade the equity curve live without seeing how the backtested results may have changed. Conceptually I like trading the equity curve because it is potentially good way of getting out of a strategy that is no longer working. But for strategies doing fine but simply going through a drawdown, what kind of effect does it have?

If one trades using the equity curve, one should test using the equity curve.

The Strategy

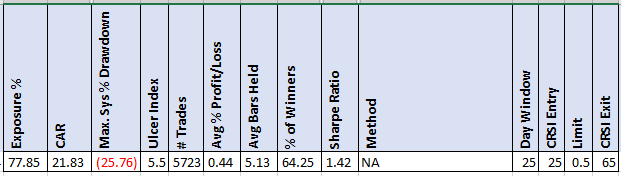
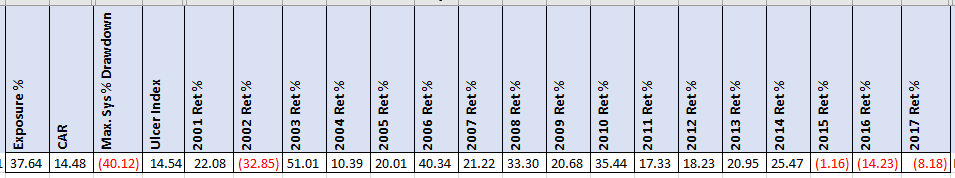
We will be using the ConnorsRSI strategy from this post. The test period is from 1/1/2001 to 12/31/2017. The reason for testing so far back is I wanted to give the equity curve signals lots of triggers. Here are the baseline results without trading the equity curve.

The Methods

These are the methods I will test. If you have other ideas, put them in the comments below. If I get enough new ones, I will test them.

  • The curve is above the (50,100,200) day moving average for last 5 days
  • The 50-day moving average is above the 200-day moving average
  • The 20-day moving average is above the 50-day moving average
  • The 50-day moving average is above the 100-day moving average
  • The (6,9,12,18) month return is greater than zero, (ROC)

The two most popular that I have seen are the equity curve being above the 200-day moving average and the 50-day moving average above the 200-day moving average. Which I have tested in the past on my own.

When the equity curve test is not true, we stop taking new trades. Any currently open trades we simply exit as they normally would.

The Results

Click for larger image.

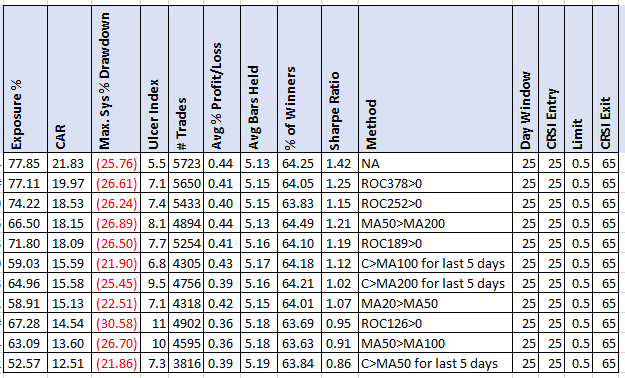
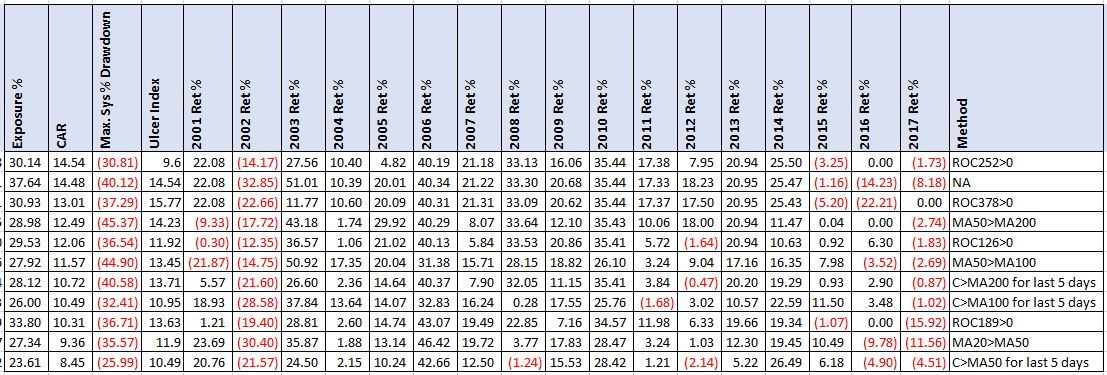
My first observation is that all the stats got worse or stayed about the same, CAR, MDD, Ulcer Index, Sharpe Ratio. Clearly using equity curve trading does not improve your strategy. Using the MA200 has a 29% reduction in CAR.

What I like is that using the 1 year return (ROC252) above zero had only 15% reduction in CAR with about the same MDD. For protection from a broken strategy this could be worthwhile. The 1.5 year rule had eve better results.

The MA50>MA200 rule did a good job. If you used the C>MA50 rule. Your results would have been greatly reduced. This is why we test ideas. You never know which ones will work and which won’t.

Different Set of Parameters

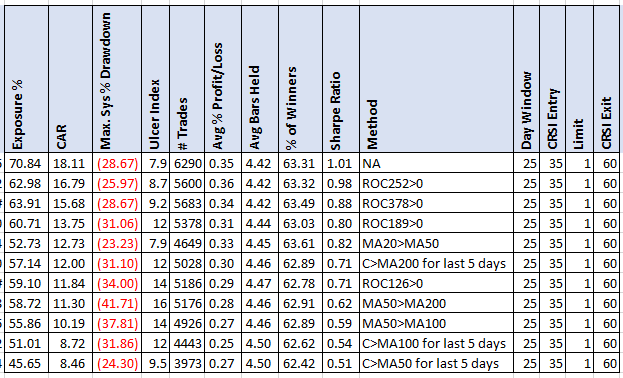
Let us see if this pattern holds up with a different set of parameters. I choose these parameters to have more volatility in the strategy and trying to see if that would make using the equity curve better.

Click for larger image.


Again, we see the one year (ROC252) and the 1.5 year (ROC378) return above zero doing well.  After that the returns really drop.

Broken Strategy

I went looking for an old strategy I traded for a few years that I stopped trading because I thought it was broken. Here are the results of that strategy since 2001 without using an equity curve.

Click for larger image.


You can see that starting 2015, it stopped working. Could using the equity curve stopped the bleed those years? Reduce the max drawdown?

Click for larger image.


At first glance this looks good. The ROC252>0 method reduces drawdowns and increases returns. The 2015 to 2017 results are better. What worries me a little is the difference between the 9 month(ROC189>0) and 18 monthROC378>0) methods as compared to the ROC252>0. Then comes the problem of how long do you give it to get back? I still believe the strategy is broken and would not start trading it again.

Spreadsheet

Fill the form below to get the spreadsheet with all the results and additional stats. I also ran with many more parameters in the ConnorsRSI strategy.

Final Thoughts

Clearly using equity curve to stop trading can have a dramatic negative change in your results. This is why you should test with this vs simply saying that is what I will do in live trading. Depending on your method you may reduce your returns by as much as 50%.

I currently don’t use this. But I like what I see for the ROC252>0 method. I must investigate this more. The big advantage of using the equity curve is that it gets you out of a broken strategy and that makes me want to investigate this more.

Backtesting platform used: AmiBroker. Data provider: Norgate Data (referral link)

Also read this post, Trading the Equity Curve – More Ideas

Good quant trading,

Fill in for free spreadsheet:

spreadsheeticon


Click Here to Leave a Comment Below

Jane - February 14, 2018 Reply

This is what I call a circuit breaker. It will hurt performance – always – but needed to reduce the risk of system failure.

    Cesar Alvarez - February 14, 2018 Reply

    The problem is if you don’t test what you are suing on your strategy, you may greatly reduce the returns which I think is worse.

Ryan - February 14, 2018 Reply

I have never been able to get equity curve trading to work without seriously impacting performance. Plus, it’s another rule that impacts degrees of freedom along with additional lines of code that need to be maintained.

I think that it’s a gimmick people use to try and cheat drawdowns (not going to work!).

There are also better ways when determining if your strategy is broken or not.

However, I respect your decision to test and test again as this is the only way that one can come up with an independent assessment on validity of the idea.

    Cesar Alvarez - February 14, 2018 Reply

    What ways do you think are better for determining if a strategy is broken or not?

Akshay - February 14, 2018 Reply

What do you use currently to know that strategy might be broken..do you have any objective rule? Since you said u stopped trading the above strategy some time back, how did you identify that?

    Cesar Alvarez - February 15, 2018 Reply

    Honestly this is my weakest area of trading. I do not have a systematic way of stopping a strategy. Every 6 months I compare the strategy’s performance to the type of market. I try to determine if the strategy has underperformed what I would expect given the market conditions. If I see 12-18 months of “poor” performance, then I stop.

Ola - February 15, 2018 Reply

Hi Cesar,
thanks for a great post.
Have you ever tried dynamically changing your position size depending on how your equity curve is doing?
Another thought (completely untested) is what you could achieve if you treated your equity curve in a trend following manner i.e. you enter and exit as if it was a trending stock?
Cheers,
Ola

    Cesar Alvarez - February 15, 2018 Reply

    I have not tested the dynamic sizing. To me, that is trying to do too much with the curve. Using the curve to trend follow is basically what all the rules I tested are doing.

Matt Griffiths - March 17, 2018 Reply

The ONLY way trading the equity curve can be beneficial is if you are trading a suite of uncorrelated models which are designed to perform in differing market conditions and you use whatever method you are using to switch strategies on and off as a method to allocate between them. It doesn’t matter which method you use to trade a system’s equity curve. If you are using it to simply turn a single system on or off in a binary fashion, it will ALWAYS underperform simply trading the system flat out through thick and thin.

    Cesar Alvarez - March 18, 2018 Reply

    Funny you mention this. My plan was to do this for a future blog post. I believe that you are correct but only the testing will see if the idea works or not. Thanks.

Slav - April 8, 2019 Reply

I think equity curve trading is valid but only on strategies that have a normal distribution of Rs. I wouldn’t do this on trend following strategy as not trading could result in missing a entry which could be a massive winner. Perhaps not shutting off the strategy is a good approach but only reducing position sizing.

    Cesar Alvarez - April 8, 2019 Reply

    That is a good point about trend following.

Occams_Razor_Trader - March 28, 2021 Reply

Hello, I just came across the post, I trade an short term algorithmic breakout system on a basket of commodities, which, after 9 months of fantastic results completely broke down in the waning 3 months of last year. I would think the method to toggle a system on and off would have to have a similar timeframe as the system itself. A 200 day moving average is a wonderful way for long term holders of equities to gauge the market regime, but isn’t very helpful for a system that trades daily and one who’s average holding period may be only a few days.
Filtering trades as well as filtering systems, after all, that’s what we’re attempting to do, must have similar and congruent timeframes or will result in too much give back. If the speed of the system signal lags the systems entry signals by too long of a period the benefit I believe would be lost.
Any thoughts??

    Cesar Alvarez - March 29, 2021 Reply

    Yes, I agree that 200days may be too long for a strategy with short holding period. Each strategy would probably have a different length that would be best for it.

Aengus - March 3, 2022 Reply

Something I consider for some systems is to calculate the Kelly coefficient going back about 100 trades. This is plotted with the equity curve with its own Y axis. If this plot is moving down towards zero, it is time to watch out or reduce exposure. It could be used as a rough guide on position sizing too.

    Cesar Alvarez - March 4, 2022 Reply

    I have never had success using Kelly. If it is working for you, great.

Matthew - March 6, 2022 Reply

Just my 2 cents worth:

I use Howard Bandy’s CAR25 metric, where I use a triangulated distribution of the last 2 years of marked to market daily returns. If that value falls below zero. The strategy moves to a shadow trading mode where it monitors the system and turns it back on only when the CAR25 metric returns above zero. My automated systems also adjust the position size of each trade using his method to determine safe_f; The position size which for me limits MDD95 to 20%. Thus if a sytem deteriorates it will first take smaller trades then turn off if its not worth the risk. (book ref: Quantitative Technical Analysis, Howard Bandy)

Other things I have tried and thought were worth more investigation at the time. When using a equity curve Moving Average, instead of turning off the system either 1) reduce the position sizing by 50% or strangely enough increase it… (I found the equity curve of ‘some’ mean reversion systems to be in themselves mean reverting). Though this defeats the purpose of protection against a broken system and will ensure larger losses if the system is in fact broken!

    Cesar Alvarez - March 7, 2022 Reply

    I am familiar with Bandy’s CAR25 metric. What you are doing is interesting. Thanks for sharing.

Erik - March 13, 2022 Reply

Here is a “walk-forward” idea that I have thought about but never tested. For example;
1. Optimize the system for 1 year from the start of the testing period (=IS).
2. Look at the resulting out-of-sample (OOS1) results for the next 3 months.
3. If the OOS1/IS > 50% then trade it for the following next 3 months (OOS2). If <50%, don't trade it.
4. Log the returns for the OOS2 period.

Repeat step 1-4 several times by shifting forward 3 months. Calculate the equity curve and the CAR, Max drawdown etc from the successive OOS2 results.
Compare with the regular equity curve.

    Cesar Alvarez - March 14, 2022 Reply

    Say you have several OOS1 results with OOS1/IS > 50%, do you then pick the one with the highest value?

Erik - March 14, 2022 Reply

The idea is to stop trading at the first OOS1/IS<50% during the walk-trough. Start trading again when OOS1/IS>50%. Then compare the trading results using this approach vs trading the whole time (regardless of the OOS1/IS ratio).

Leave a Reply: