- in General by Cesar Alvarez
The Power of Strategy Diversification
A reader sent me an email about playing around with The Spreadsheet tool I have. This free tool allows you to combine strategies to see how they would do together. You can import your own equity data to see how your strategies do. He had combined three Tranquility Trading strategies and the results looked good with an annual return of 24% and a drawdown of 23%.
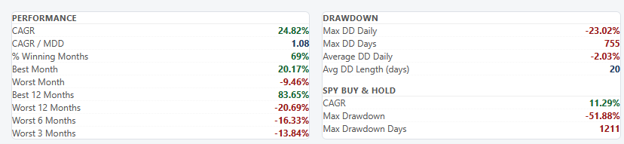
While looking at the screenshot he sent me, I thought there might be a bug. One of the strategies he was using, I knew, had a 54% drawdown. But the combined strategies only had a 23% drawdown. That seemed too low.
Oh crap, there must be a bug in The Spreadsheet. There is no way that the combined strategies had only a 23% drawdown.
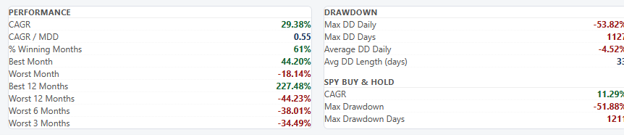
I have written on the benefits of strategy diversification before: Trading Multiple Strategies. I am aware that combining strategies may reduce the drawdown but I was not expecting this much of an improvement. I coded this up in AmiBroker and got the same results. Whew, no bug. While doing the investigation, I had forgotten the low drawdown of the other two strategies.
This now got me curious about the correlation between the three strategies. Using my Correlation Matrix tool, we get this.
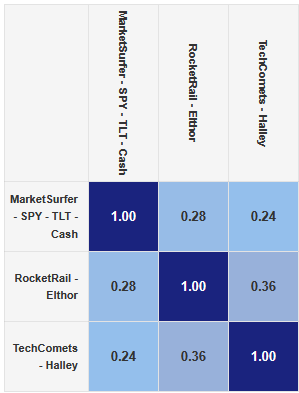
Low correlation between the three strategies but none are negative. The reason for the low correlation is that each strategy is conceptually different. Market Surfer trades the SPY/TLT based on various market indicators. Rocket Rail is a mean reversion strategy. Tech Comets is a momentum strategy.
This little (panic) exercise reinforced why we should be trading multiple strategies with different concepts.
Both The Spreadsheet and Correlation Matrix are free tools that you can import your own daily equity data into, allowing you to see how your strategies do together.
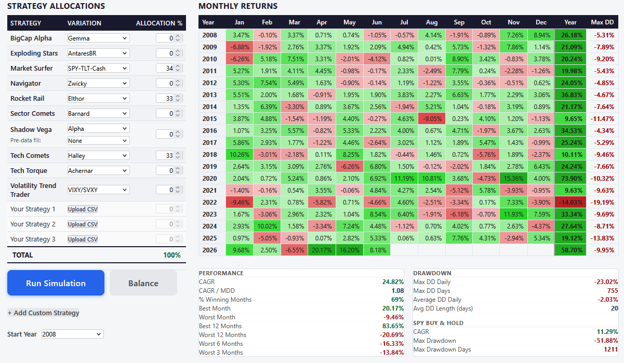
Play with the tools and have fun!
Good quant trading,