
- in Mean Reversion , Research , Stocks , Trend Following by Cesar Alvarez
StockCharts Technical Rank (SCTR) Indicator Analysis
Overall the last few months, I’ve had several consulting client’s strategy use SCTR for either a ranking or a filter. I finally got curious about the predictive ability of SCTR. How good is? I could find no information on how each of the ranking buckets did X days later on StockCharts.com. Maybe these results are hidden behind the paywall which I do not have access to.
I developed PowerRatings for TradingMarkets.com and understand how hard it is to make a ranking indicator that works. Is SCTR an indicator I should be using for medium to longer term strategies? What will the numbers to us?
9/19/2018: Make sure and read my follow up post, StockCharts Technical Rank (SCTR) Rotation Strategy, where the results are very different.
StockCharts Technical Rank (SCTR) Calculation
The synopsis of SCTR is it uses the following;
Long-Term Indicators (60% weighting)
- Percent above/below 200-day EMA (30%)
- 125-Day Rate-of-Change (30%)
Medium-Term Indicators (30% weighting)
- Percent above/below 50-day EMA (15%)
- 20-day Rate-of-Change (15%)
Short-Term Indicators (10% weighting)
- 3-day slope of PPO-Histogram (5%)
- 14-day RSI (5%)
Each stock raw SCTR value is calculated and then sorted against all the others in the universe. Then divided by the number in the universe to give all stocks a value between 0 and 99.99 with approximately the same number of stocks in each decile. To get the full details on the calculation see StockCharts Technical Rank (SCTR).
Notice that the longer term indicator has 60% weighting vs 10% for the shorter term one. This leads me to believe that longer holds will do better.
StockCharts applies SCTR to these universes
- Large-Cap – US stocks that are components of the S&P 500 Index (or were in the past).
- Small-Cap – US stocks that are components of the Russell 2000 Index.
- Mid-Cap – US stocks that have a significant market cap but do not fall into either the Large-Cap or Small-Cap universes.
Thank You to Art
Arthur Hill CMT, Senior Technical Analyst at StockCharts.com, provided AmiBroker code for the calculation of the raw score. This greatly helped in making sure I got that part right.
My Test
Test date range is from 1/1/2007 to 6/30/2017. The end date was chosen so we could still calculate a 252 day return.
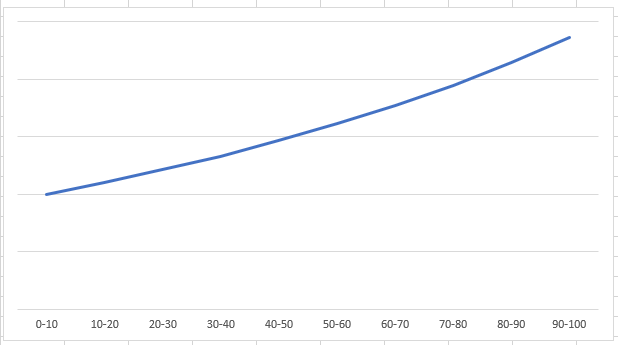
Everyday I calculate the SCTR of a stock when it is in the index (S&P500, Russell 3000). Then I calculate the return (5,21,126,252) days later. This is approximately 1 week, 1 month, 6 months and 1 year later. From this I compare each decile return. In a perfect world, those with a rank 0-10 would have smaller return than 10-20. And those with rank of 20-30 would have a higher return than then the previous bucket. And on to the top bucket of 90-100 which should have the best return. This is the chart in the perfect world.
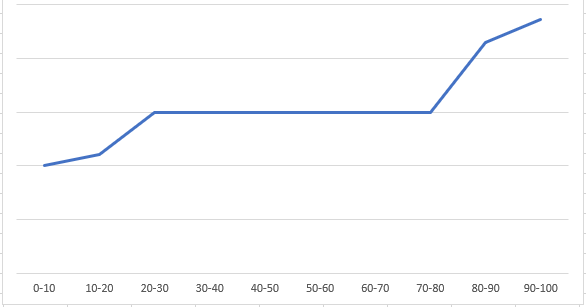
But a chart like the one below is also good. Where the ends are very different.
My test is not exactly the same universe as StockCharts but I would not expect there to be much difference. The tests results are based on entering and exiting at the close. If a stock stops trading before the end of the hold period, we simply use the last trade price. No volume or price filters were used because I could not find any mention of this.
Extraordinary Returns
An issue we run into when doing this type of analysis is what do with very large returns. In the S&P500 results there is a return of nearly 1000% in one year. In the Russell 3000 results, there are returns over 3000%. I find that these results skew the results and therefore cap them.
For the numbers I am presenting I am capping the returns. If a stock has a return over the cap value, then the return is set to the cap value. Here are the cap values
- 5 day hold: 100%
- 21 day hold: 200%
- 126 day hold: 300%
- 252 day hold: 500%
The spreadsheet will include the data for not using a cap.
S&P500
There are 1.3 million trades with about 130K trades per bucket.
S&P500 – 5 Day Return
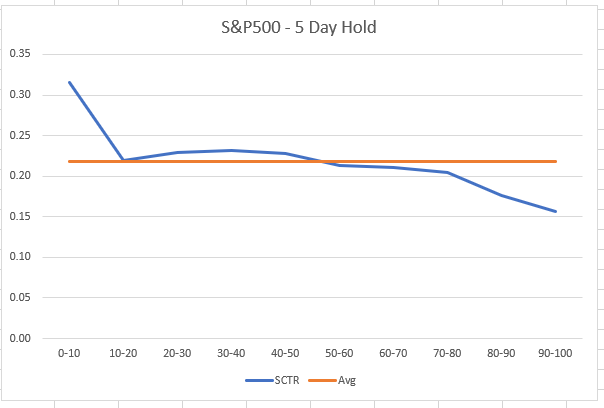
Well for a short-term hold, SCTR seems to be a mean reversion indicator. The 0-10 rank has a return of .32 vs .16 for the 90-100 rank. This is surprising given that the short-term portion of SCTR only has 10% weight. But this difference is not very big or very different from the average.
The orange “Avg” line in the charts is the average of all the trades for the holding period.
S&P500 – 21 Day Return
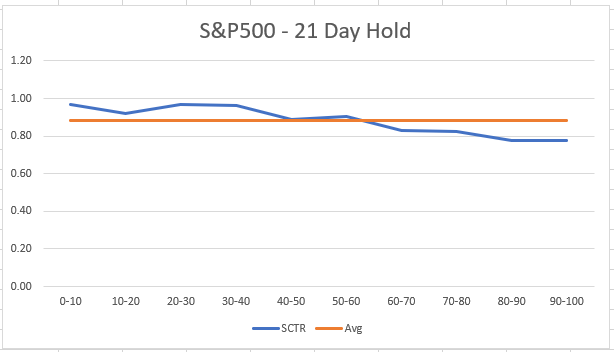
Again, we see the slope of the returns going the wrong way from my expectation. It is a good sign that there is a trend. The return goes from .97 to .78 compared to the average of .88. Not a lot of information one can use to trade. But it is the longer holds that I expect more from since they have a weighting of 60%
S&P500 – 126 Day Return
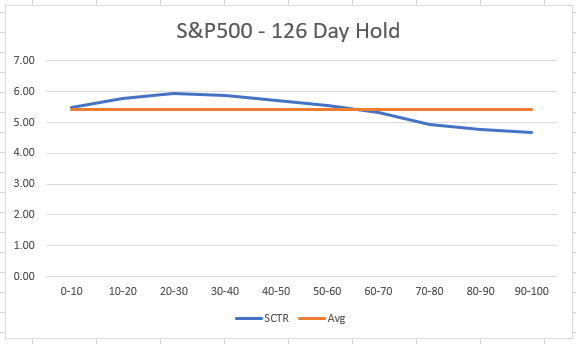
Unfortunately, nothing is here. Rank under 10 has a return of 5.50 and rank over 90 has a return of 4.66 compared to the average of 5.41. The last hope is the 252 day hold.
S&P500 – 252 Day Return
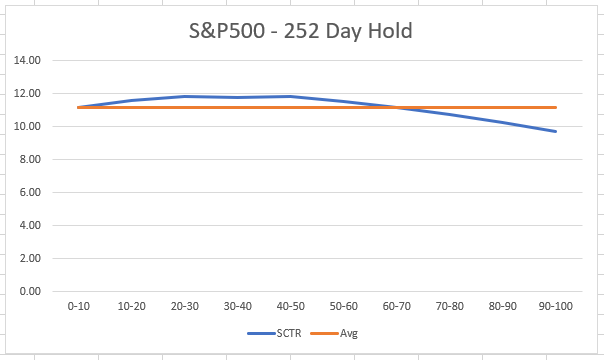
Same general results here too. Rank under 10 has a return of 11.20 and rank over 90 has a return of 9.69 compared to the average of 11.16. This is not good. There is not pratical difference in the buckets to trade.
A Mistake?
At this point I was wondering if I made a mistake. The most obvious thing being I sorted the raw score in the wrong order before ranking between 0 and 100. I double checked the code and hand did some rankings in Excel but I got the same SCTR score. I looked at charts and those with rank above 90 had nice looking uptrending charts and those with scores under 10 had downtrending charts. This is what I expected.
I hand checked my SQL code that I was using to summarize the data and still got the same results. I waited a day and checked again. Still everything checked out.
S&P500 – Above MA200
Since at all times stocks there has be equal number of stocks in each rank bucket even if all stocks are in downtrend, maybe we should only focus on stocks above their 200 day moving average. Let’s see if that helps or not. I will focus on the longer holds because the SCTR formula seems favor that. The spreadsheet will have the all the holds data.
S&P500 – 126 Day Return, Above MA200
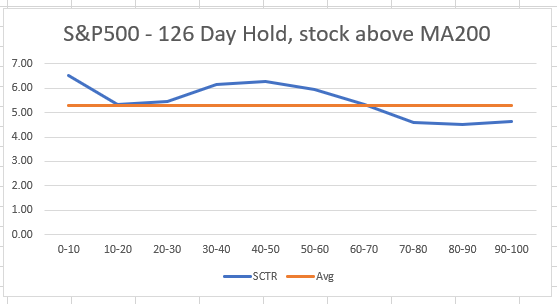
Same general story. Rank under 10 has a return of 6.51 (5350 trades) and rank over 90 has a return of 4.65 (126311 trades) compared to the average of 5.28. There just is not enough pratical difference in the either the rank under 10 or rank over 90 compared to the average to trade.
S&P500 – 252 Day Return, Above MA200
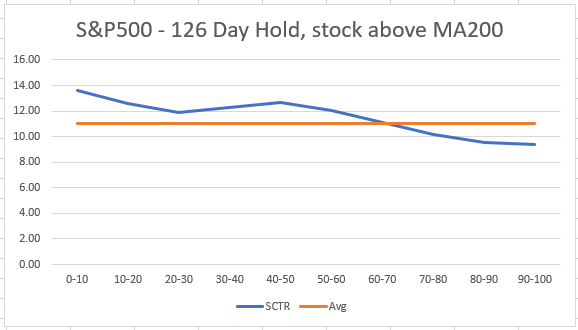
The line does go in a trend but again not much pratical differnce from the average. Rank under 10 has a return of 13.57 (5350 trades) and rank over 90 (126311 trades) has a return of 9.37 compared to the average of 11.01
First Thoughts
I really did want this to work. But as a general ranking indicator, SCTR seems to point in the opposite direction. Which I would be fine with. Maybe the data on the Russell 3000 will yield different results?
Russell 3000
There are 7.6 million trades with about 760K trades per bucket.
Again, I will be capping the results. Unfortunately, the same pattern holds for the Russell 3000. I will not showing all the results but they will be in the spreadsheet. Here are some interesting ones I found.
R3000 – 5 Day Return, Above MA200
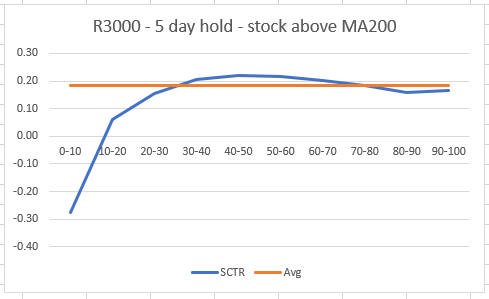
Here we can see rank under 10 has a return of -.28 (3954 trades). This points to avoiding these stocks. This is the first pratical differnce I have seen. I would want to look furhter into the data to make sure it is not a few trades causing this.
R3000 – 126 Day Return, Above MA200
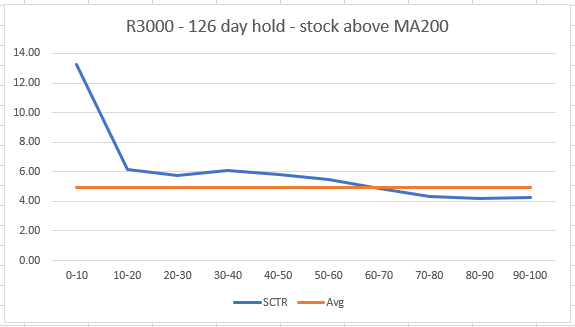
Another potential. But then in this case the rank under 10 has a 13.25 (3954) return. Is this a quirk of a couple of really good trades? Don’t know without spending lots of time digging into the data.
R3000 – Below MA200
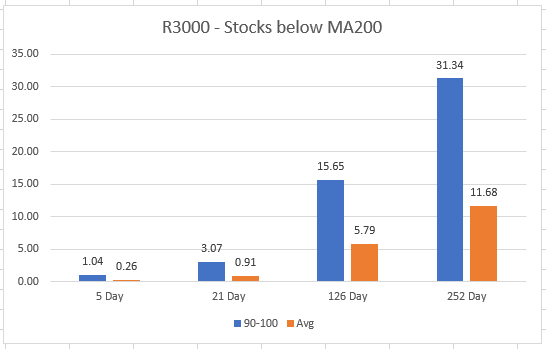
Finally, the above 90 rank bucket does well. For all hold periods the above 90 bucket substantially outperforms the average. A curious question. How much is this influenced by 2009 bounce? Or very low priced stocks that have huge moves? These results are good but given everything else I have seen, I would want to investigate more before trading off of them.
Spreadsheet
Fill in the form below to get the spreadsheet with lots data. This includes the non-capped results, all the stats for above and below the MA200 and standard deviations.
Final Thoughts
Summary: In general StockCharts Technical Rank (SCTR) does show an ability to rank the stocks. Two issues, though. One, it is the reverse as stated on the StockCharts website. Two, the differnce from average is too small to be pratical.
Will I be using SCTR in the future? No. Even though the rank under 10 often outperformed the average for most holds, it was not a big enough outperformance to be pratical. The same is true for under 90 for most cases, that tehy underperform the aveage but not by a lot. The numbers just don’t seem to justify using SCTR in my trading. My goal was to see what the numbers would tell me.
From my results am I saying that SCTR does not work? Yes and no. It will not work for me because I am simple guy and like it when the data simply points to it working. Could SCTR work with some other indicators or with discretion? Yes.
I did not test exactly the same universe as described on StockCharts. Could this make a difference? Yes. But I really would hope it would not make that much of difference.
Could I have made an error? Of course. That is true for all my posts. As always, I double check my numbers and try to put out correct results. But this type of testing is more complicated and easier to make mistakes in. I will admit to higher chance of a mistake being made, but I have checked enough to feel comfortable posting the results. If I do find a mistake or one is pointed out to me, I will make sure to post a correction.
Could looking at the data differently yield different results? Yes. Maybe focusing on % correct. Or adding a better trend filter? Or testing SCTR as a ranking filter in a strategy compared to other ranking filters. Something I would add is a price and volume filter. Maybe using the raw SCTR value is better? If I get enough emails or comments, I can always do another post on SCTR.
9/19/2018: Make sure and read my follow up post, StockCharts Technical Rank (SCTR) Rotation Strategy, where the results are very different.
Backtesting platform used: AmiBroker. Data provider: Norgate Data (referral link)
Good quant trading,

Fill in for free spreadsheet:

