
- in Data by Cesar Alvarez
Pre-inclusion Bias: How to create a false strategy
In the previous post I described a simple rule to double the returns of a mean reversion strategy. In this post, I show how pre-inclusion bias can take a losing strategy and make it a winning one.
Recently I had reader send me the rules for a stock trend following strategy. He knew these are the strategies I have been researching lately. The rules were few and I had time, so I coded it up.
Here is my definition of pre-inclusion bias from How much does not having survivorship free data change test results?
Pre-inclusion bias is using today’s index constituents as your trading universe and assuming these stocks were always in the index during your testing period. For example if one were testing back to 2004, GOOG did not enter the S&P500 index until early 2006 at a price of $390. But your testing could potentially trade GOOG during the huge rise from $100 to $300.
The Rules
I will not be sharing the rules but the general idea. Test is from 1/1/2007 to 6/30/2018.
Buy
- Some trend following rules
- Stock price is between $1 and $20
- Stock is member of the Russell 3000
Sell
- Trend is broken
I made two assumptions about the rules. For rule (B), I assumed that this was the as traded price. Meaning this is the stock price without adjustment for stock splits or dividends. If one went back in time, this is the price one would have seen on the chart that day. The farther one tests back in time the more pronounced the change in your results this can have.
The second assumption was for rule (C). I assumed that this is using the historical constituent information.
Because I use Norgate Data and subscribe to the historical constituent data, I can test this way.
Bias free and as traded results
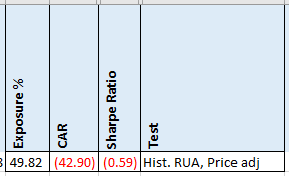
Well those numbers just suck. My first thought was I had made a coding error. After double checking and triple checking, I was sure I had not. Then came my next thought. Maybe they were using current Russell 3000 and adjusted prices. After a couple of emails, I confirmed this was the case.
With bias and adjusted prices results
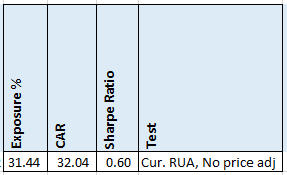
Now we have a positive CAR. As you can see there is a huge difference between these two results.
All combinations
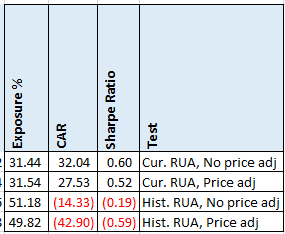
These results are the four combinations of using Current vs Historical Data and As-Traded vs Adjusted Prices.
Spreadsheet
File the form below to get the spreadsheet with lots of additional information. This includes top drawdowns, trade statistics and more.
Final Thoughts
People frequently ask me how important it is to have historical constituent data. Short answer, very! I do not trust any results that have pre-inclusion bias.
Backtesting platform used: AmiBroker. Data provider: Norgate Data (referral link)
Good quant trading,

Fill in for free spreadsheet:
