
- in Mean Reversion , Research , Stocks by Cesar Alvarez
Avoiding Gap Trades
Should you avoid trades that have recently gapped? What if you are trading a mean reversion strategy and a stock has recently had a large gap? Is that a good trade to take? Avoid? Does it depend on the direction of the gap? I did research on this about 15 years ago. Let’s see what the current research says.
Definition of Gap and Lap
A gap is when a stock opens above the previous day’s high or below the previous day’s low.
A lap is when a stock opens above the previous day’s close or below the previous day’s close.
I find most people use ‘gap’ to mean both a ‘lap’ or a ‘gap.’ I will use this definition for a gap.
The Base Strategy
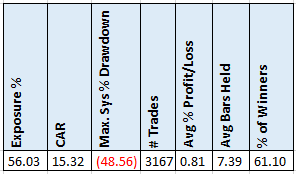
These rules were chosen to have lots of trades and a large drawdown. I want to see how adding the gap rules helps these metrics. This is not a strategy I would trade given the large drawdown and the small average % profit/loss per trade. But maybe you like these numbers.
Setup Rules
- Stock is a member or was a member of the Russell 3000
- The Dollar Volume of stocks is greater than $500,000
- Close is above $1
- Close is above the 200-day moving average
- The 2-period RSI is below 5
Rank stocks from high to low using 100-day historical volatility. Place limit orders 4% below close for the next day. Trade 20% per position. Only place enough orders such that if they all fill, then will be 100% invested.
Sell Rule
- The 2-period RSI closes above 70, exit on next open
- If in position after 10 trading days, exit on next open
Base Results
Here are the results of the base strategy
Avoiding Gap Trades
I wanted to research three characteristics about the gaps
- The percent change from the previous close to the current open
- How recently the gap happened
- The direction of the gap. Meaning is it above the open or below the open
No 5% Gaps in Last 10 Days
These results from not allowing trade setups for stocks with a 5% or more gap in the last 10 days.
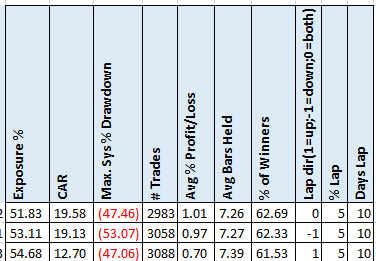
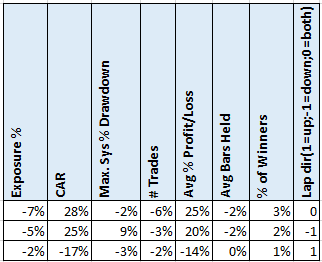
The first row is for gaps in both directions. We can see a 28% increase in CAR and a 25% increase in Avg % p/l while only a 6% decrease in trades. This really points to avoiding these recent gap trades. Looking at the results when avoiding stocks that gap down, we can see these are the stocks to avoid.
Here we have the percentage change from the base for each of the stats
No 5% Gaps in Last 5 Days
How about a short lookback window?

Again, avoiding those lap down stocks is a good thing. Surprisingly this is only 61 fewer trades.
No 10% Gaps in Last 10 Days
My fear with this is that it does not happen often enough
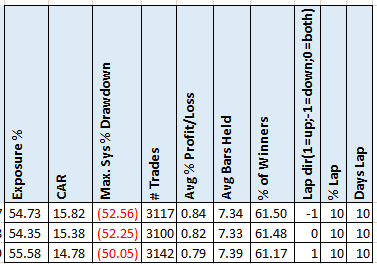
Which is borne out in the number of trades.
I tested gaps of (5, 7.5, 10, 12.5, 15) and days of (5, 10, 15, 20). The results can be found in the spreadsheet.
Spreadsheet
Fill in the form below to get the spreadsheet with lots of additional information. See the results of all variations from the optimization run. This includes top drawdowns, trade statistics and more.
Final Thoughts
These results did not come in as expected. I was expecting either no change in results or favor skipping trades that gap up. But the research points to skipping trades that recently gapped down. As always, these results are only for this strategy. Does this apply to all mean reversion strategies? I don’t know but I will be trying this rule out to the ones I do trade. I suggest you do too.
Backtesting platform used: AmiBroker. Data provider: Norgate Data (referral link)
Good quant trading,

Fill in for free spreadsheet:
