- in General , Market Timing by Cesar Alvarez
Escalator on way up. Broken elevator on the way down.
I have been waiting for a close under 2350 to write this post. Today the $SPX closed at 2304.92.
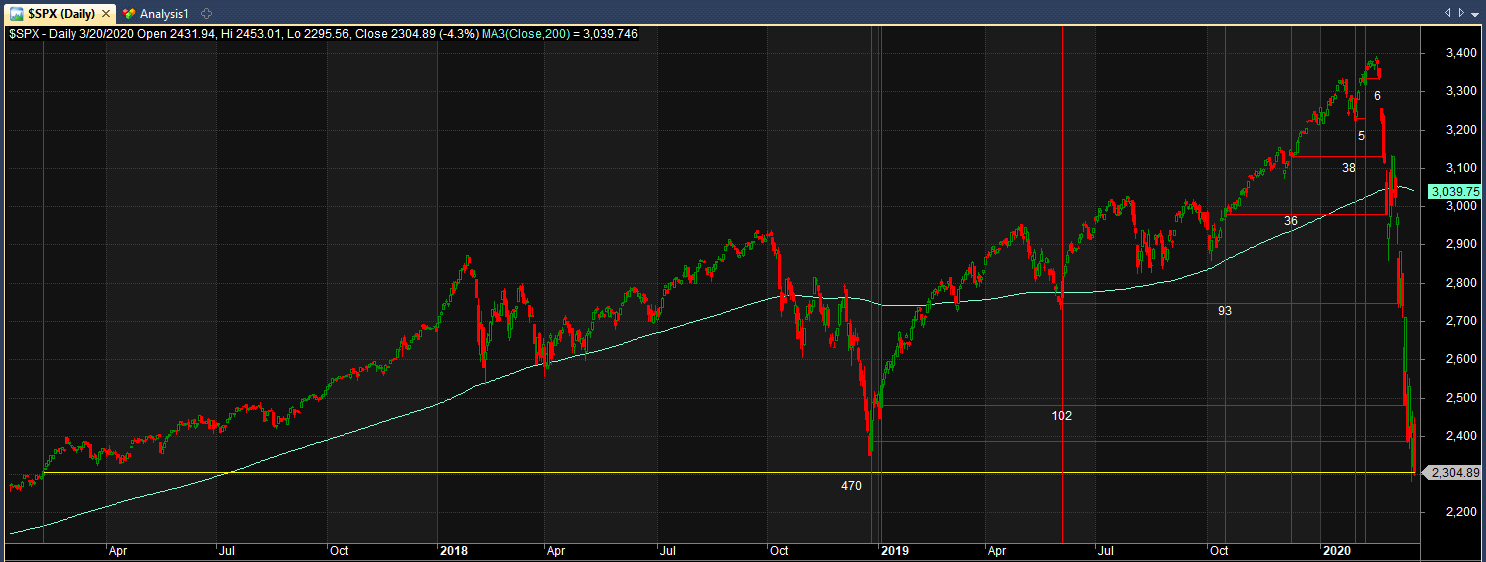
Markets slowly grind up. But crash quickly. How quickly? I will be looking at each new drawdown low since the market top on February 19, 2020 and then seeing how many days of market gains were erased since the previous time
The Chart
Click on the chart to see the full image.
The dates below are new maximum drawdowns since the market top.
February 21, 2020
Market closes at 1.4% drawdown. Erases 6 days of gains.
February 24, 2020
Market closes at 4.7% drawdown. Erases 5 days of gains.
February 25, 2020
Market closes at 7.6% drawdown. Erases 38 days of gains.
February 27, 2020
Market closes at 12.0% drawdown. Erases 38 days of gains.
February 28, 2020
Market closes at 12.8% drawdown. Erases 2 days of gains.
March 9, 2020
Market closes at 12.0% drawdown. Erases 93 days of gains.
March 12, 2020
Market closes at 26.7% drawdown. Erases 102 days of gains.
March 16, 2020
Market closes at 29.5% drawdown. Erases 7 days of gains.
March 20, 2020
Market closes at 31.9% drawdown. Erases 470 days of gains.
All market gains back since February 9, 2017 have now been erased. 760 days of gains lost in 22 days.
The markets need to fall another 34% from the current close to match the 2008 drawdown. There is still a high possibility of more pain.
Be careful trading now.
Backtesting platform used: AmiBroker. Data provider: Norgate Data (referral link)
Good quant trading,


