
- in ETFs , Research , Stocks by Cesar Alvarez
Correlations go to One
There is a saying: “in bear markets correlations go to one.” I wanted to see how true that is for both stocks and a basket of ETFs. Now they don’t go to exactly one, not that I expected that, but they take some large steps towards one.
Definitions
When calculating correlation, I am using the daily percentage move of the stock.
When I give a date range, the last day of the range is the day the calculation is done. The length of the lookback is the number of trading days in the date range.
In these charts, green is a correlation of one. Yellow is zero. Red is minus one.
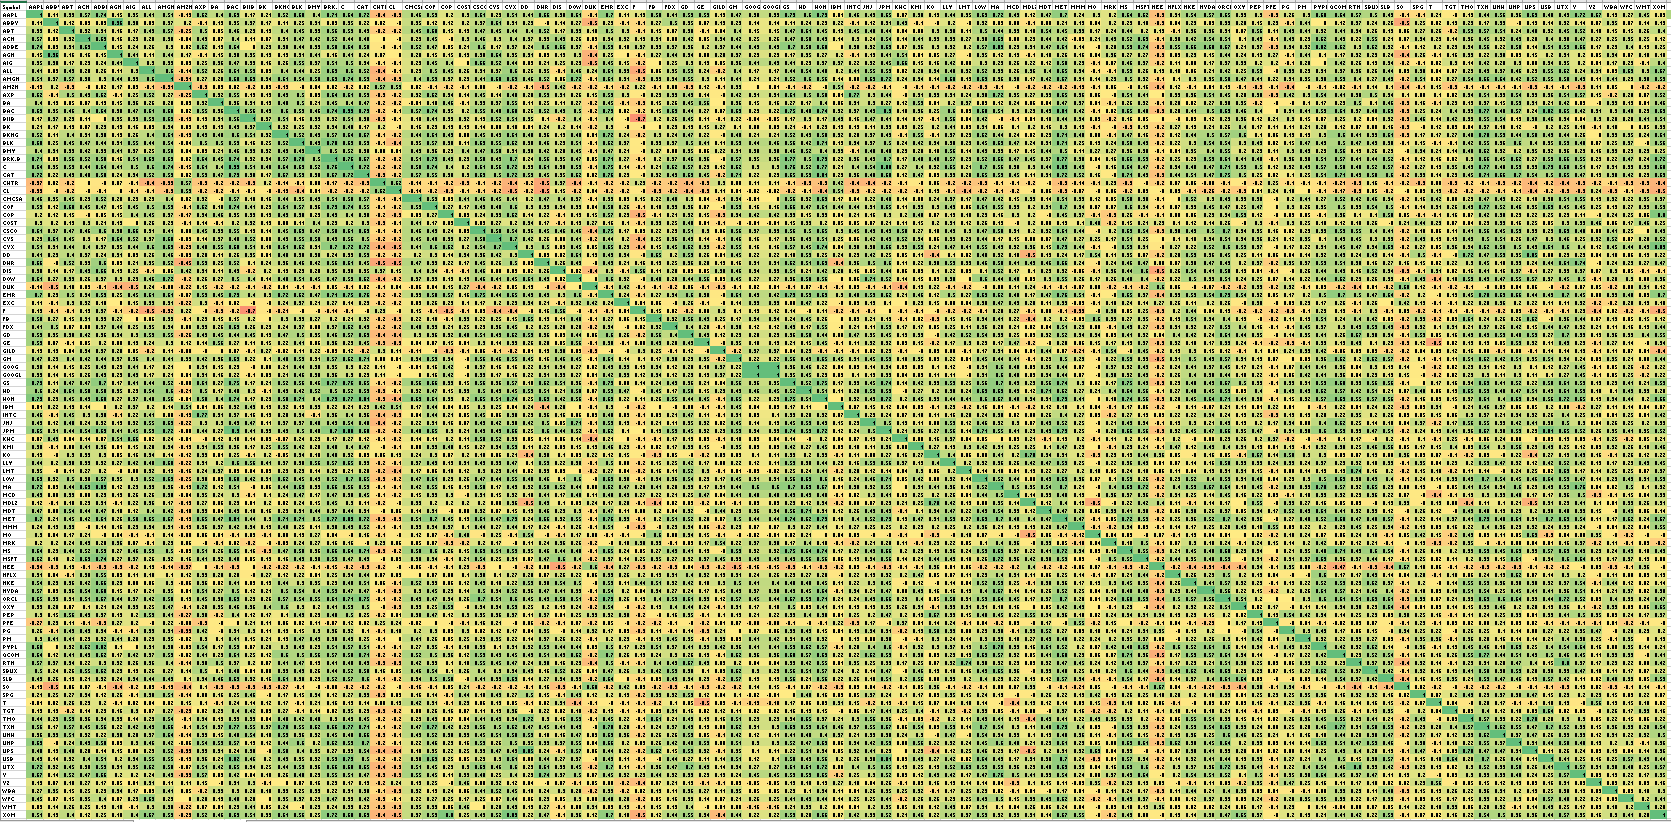
S&P100: January 1, 2020 to February 19, 2020
Looking back from the market top, February 19, I calculated 33-day correlation for all stocks in the S&P100. There are 5050 pairwise correlations. Of those how many had a correlation above .70, which is typically considered strongly correlated? Only 100 or 2%.
Lots of yellow and some reds in the chart below.
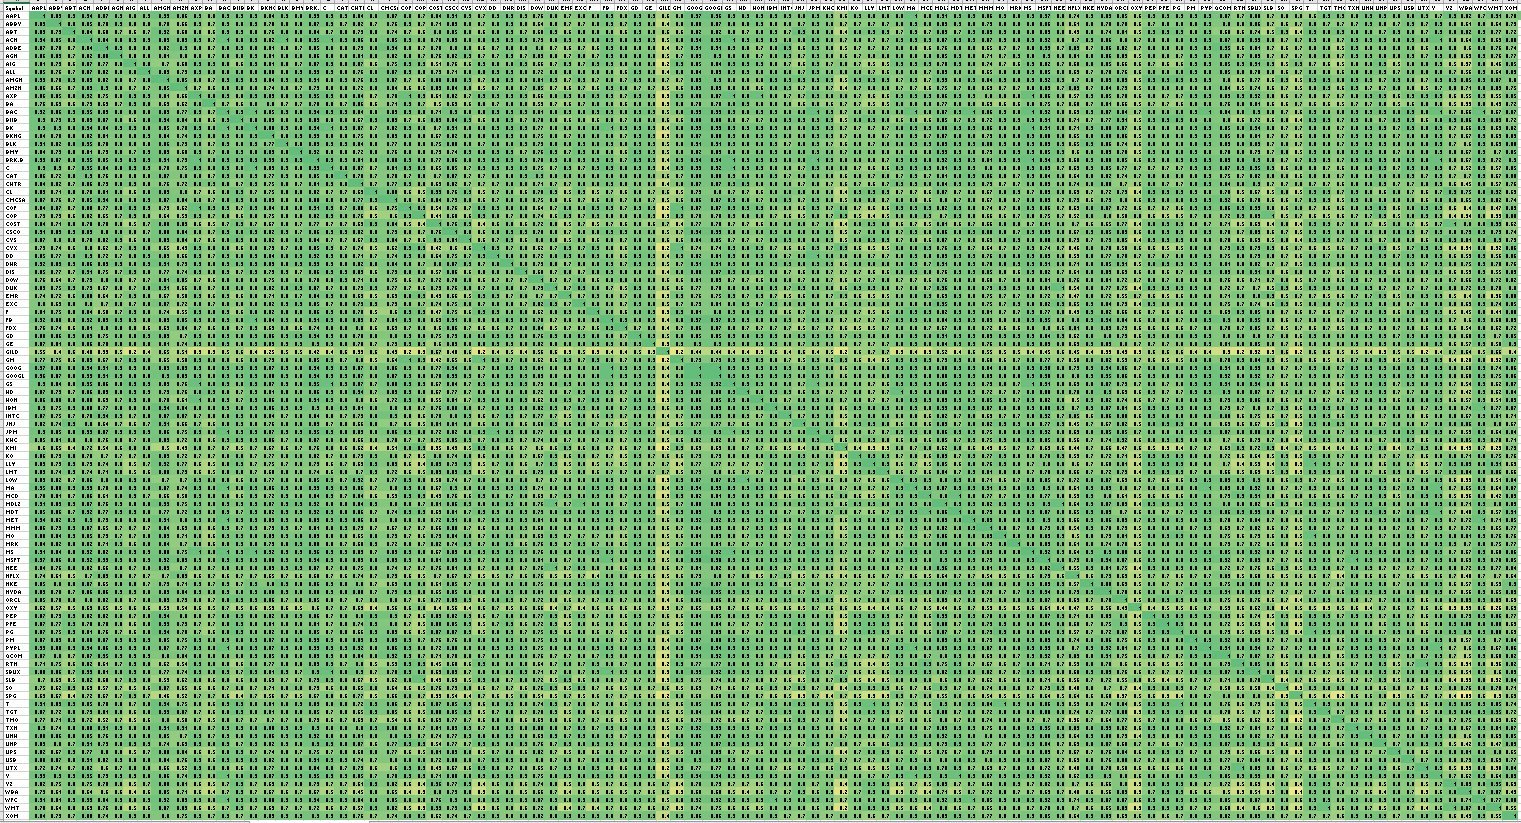
S&P100: February 20, 2020 to March 24, 2020
On March 24, I calculated the 24-day correlation of all the stocks. Of those 5050 pairs, 75.5% had correlations over .70. WOW! Now that is taking a huge step towards a correlation of one. I did not expect the number to jump up that much.
A sea of green.
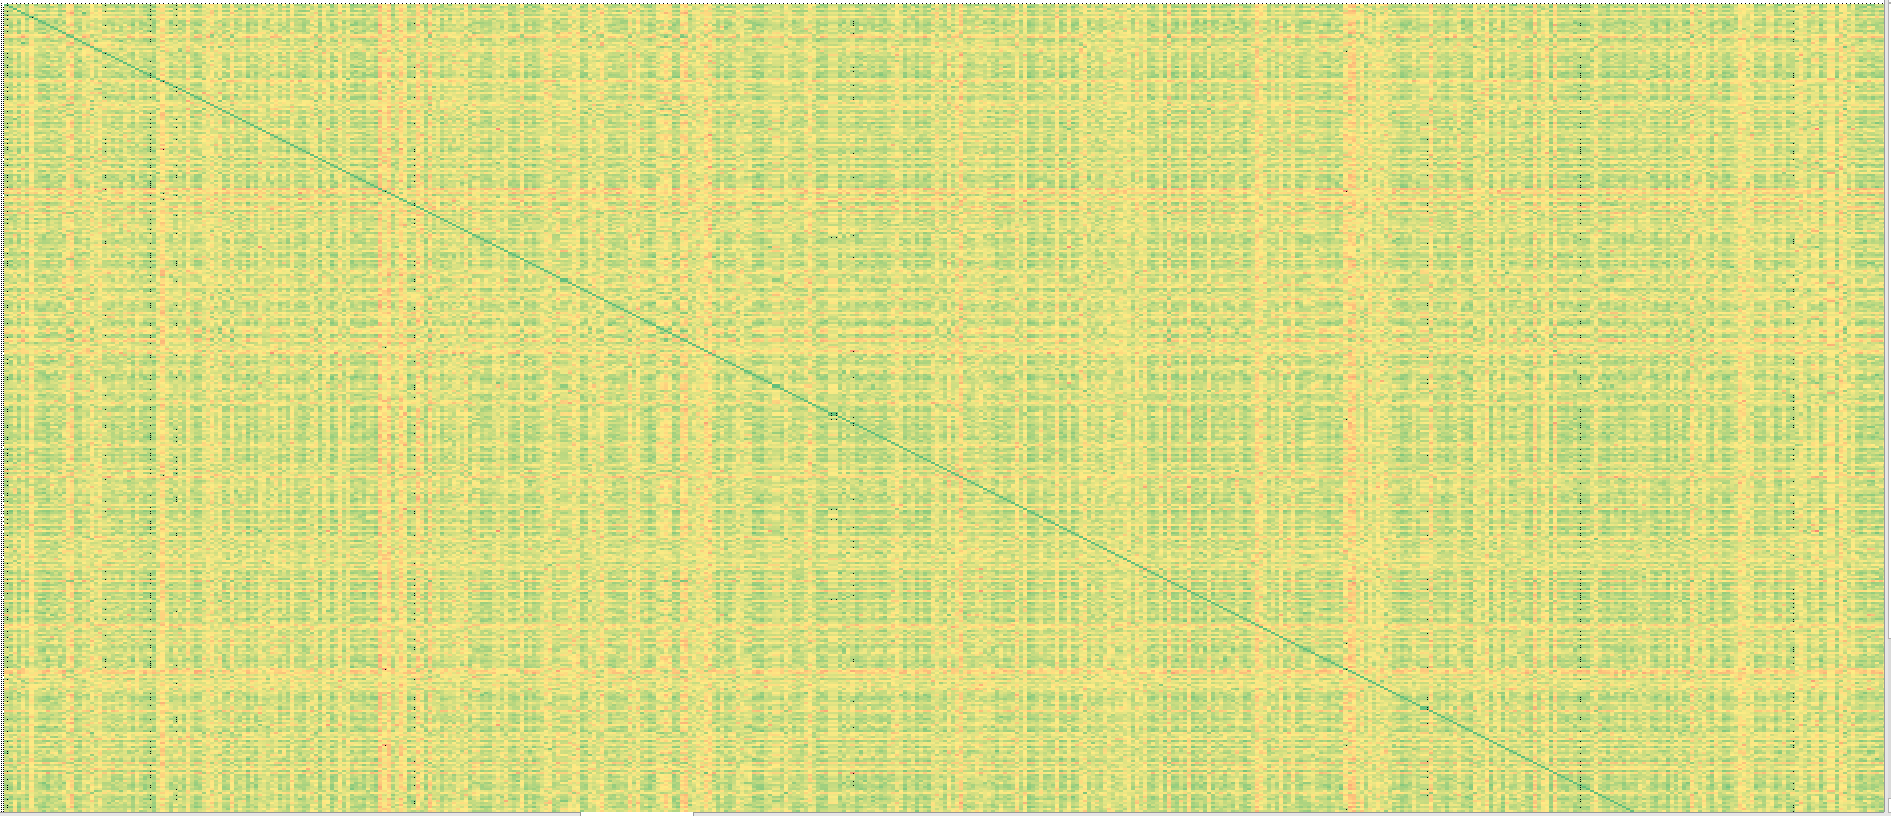
S&P500: January 1, 2020 to February 19, 2020
What if we expand this to a bigger universe? Using the S&P500 we have 127,765 pairs. Of those 1.3% have correlation over .70.
I could not shrink zoom out far enough to get all the data.
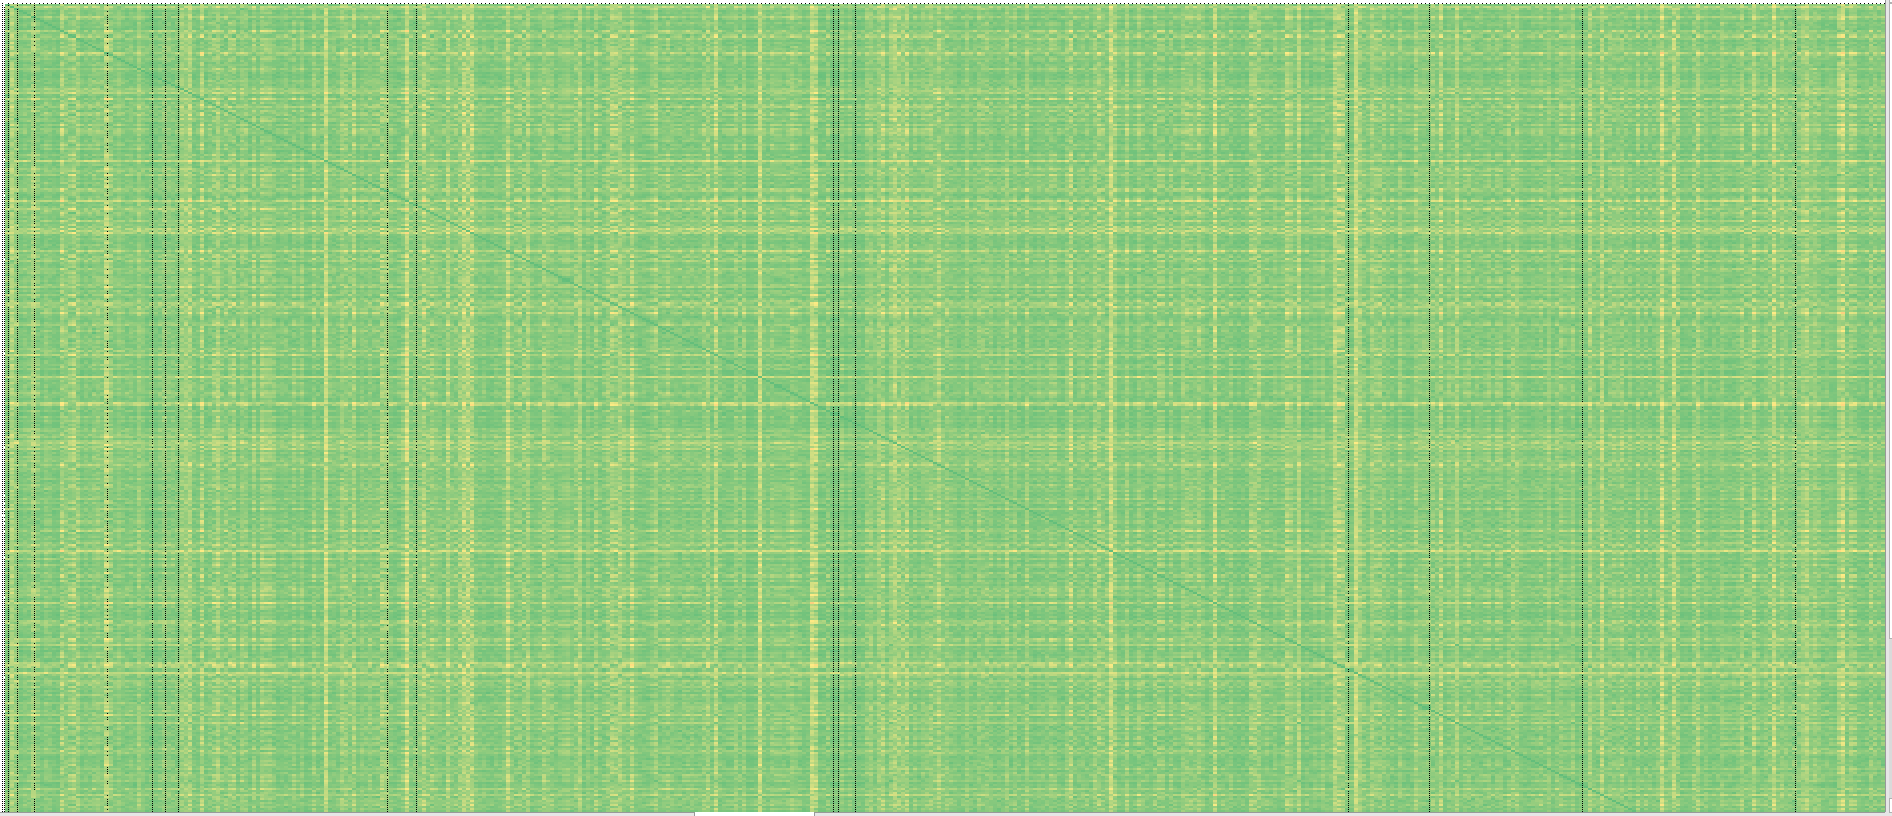
S&P500: February 20, 2020 to March 24, 2020
Now we have 56.4% of the pair with correlations over .70. Not as high as the S&P100 but still a very large amount.
Back to our sea of green but with a little more yellow.
Tactical Asset Allocation (TAA)
TAA is a popular method of investing ETFs that are in different markets that are not supposed to go to one when the bear hits.
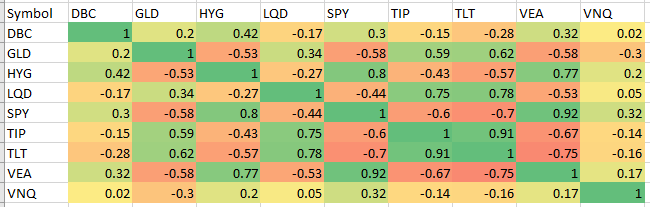
I used the following ETFs: DBC (commodities), GLD (gold), HYG (high yield), LQD (corporate debt), SPY (big cap USA), TIP (TIPS), TLT (long-term bonds), VEA (international stocks), VNQ (real estate).
TAA: January 1, 2020 to February 19, 2020
We have 36 pairs and 16.7% of them have correlation over .70
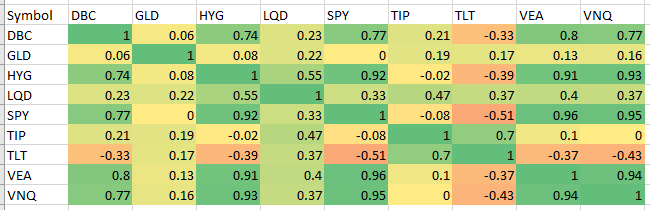
TAA: February 20, 2020 to March 24, 2020
Now we have 27.8% of them have correlation over .70.
TAA: Inverse Correlations
What about the number of ETFs that are no longer inversely correlated? During the first half of the year, 11 pairs had correlations under -.30. During this sell off the number has dropped to 5
Spreadsheet
Fill in the form below to get the spreadsheet with all the tables.
Final Thoughts
Do the correlations go to one? No. But they do take a large step there. Strategies that look uncorrelated during normal times may suddenly become strongly correlated. The only potential strategies that now are short strategies but those are hard to trade during the 95% of the time the market is quiet and moving up.
As my trading buddy said when seeing this: “It’s impossible to make systems uncorrelated-unless you just directly hedge what you have with for example puts.”
Keep calm. Be safe. Stay healthy.
Backtesting platform used: AmiBroker. Data provider: Norgate Data (referral link)
Good quant trading,

Fill in for free spreadsheet:
