
- in Research by Cesar Alvarez
Trading Multiple Strategies
Using strategy diversification is one of the easiest ways to improve the performance and reduce risk of your overall portfolio. Trading one strategy is risky because you never know when it may stop working or simply go into a period of under-performance.
Given two strategies to trade, the questions I have are, what is the performance of trading them together? What percentage of the total portfolio should be allocated to each strategy? How often should I rebalance that allocation?
AmiBroker
Depending on your backtesting platform, this may be easy to do. AmiBroker, my backtesting platform, does not make this easy to do. What I need to do is run each strategy and create an equity curve for each. Then I can combine the equity curves to see how the strategies perform together.
Using this method, can give a reasonable approximation of most of the portfolio level metrics that I care about: Compounded Annual Return, Maximum Drawdown, Ulcer Index, Sharpe Ratio, top 5 drawdowns.
Cons of combining equity curves
Metrics that cannot be calculated using this method: average percent exposure, all trade level metrics.
Since there is no trade level information, you may enter the same symbol in multiple strategies. Depending on how you trade, you may decide when you get multiple signals in the same symbol to ignore one so as not to increase your single stock risk.
Assumes rebalancing is cost free and happens at the close.
Equity Allocation
When you start trading your multiple strategies, you need to decide what percentage of your total portfolio you will allocate to each. Will be equal weight? Or less to the more volatile strategy?
My preference is to do equal weight. But if I am trading a highly volatile strategy, I will often reduce the allocation in half.
Rebalancing
There are two general ways to trade multiple strategies with regard to rebalancing.
Shared Pool
A shared pool means that on every new trade you take the value of the total combined portfolio into account when deciding trading size. In this case, there is no active rebalancing. This could thought as continuous rebalancing on every new trade.
For example, you are trading two strategies with a current total portfolio value of $120,000. Your allocation is 60/40. Each strategy is trading 10 equal weight positions. If you get a new trade in each strategy, your position size for the trade in the strategy 1 is $120,000*.60*.10 or $7,200. While your trade in strategy two is $120,000*.40*.10 or $4800.
This trade allocation does not depend at all how each of the strategies has been performing this year.
When testing this way, I typically set the rebalance period to be about the length of the average trade length for all the strategies.
This is how most people trade multiple strategies because it is easy to do. I do not use this method for two reasons. One, this method takes money away from a strategy that is performing well and adds money to a strategy that is performing poorly. Two, I like to know how my actual live results compare to backtested results which this method makes harder to compare.
This method does give a good approximation of your live trading results.
Separated Pool
In the separated pool method, imagine that each strategy is trading at a separate brokerage account. Then at each rebalance period money is moved between the accounts to get the allocations back to what we started with.
For example, we have two strategies with a 60/40 allocation. We put $60,000 at E*TRADE and $40,000 at Interactive Brokers and we are rebalancing every 6 months. Six months later strategy one is worth $50,000 and strategy two is worth $60,000. Our total portfolio is worth $110,000. We then need to move $16,000 to E*TRADE because that is $110,000*.6-$60,000. While we need to sell $16,00 from IB to move E*TRADE to get back to 60/40.
In reality, this is normally done in one account and requires much more work to keep track of. But this then allows you to easily compare your backtested results with your actual results.
This method should match your live trading results if you allow the same trade in multiple strategies.
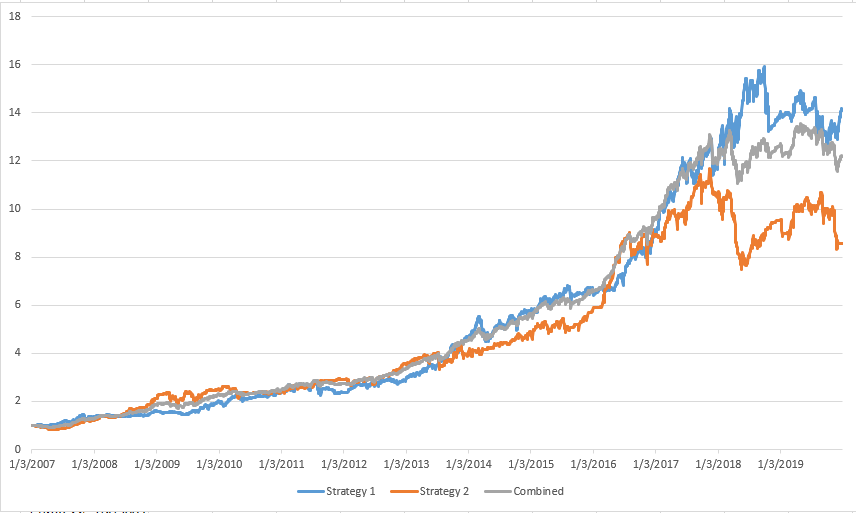
Combing Two Strategies
Let’s see what happens when we combine the following two strategies.
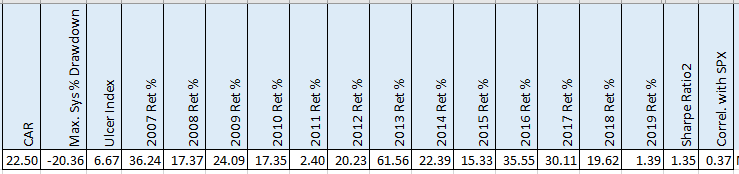
Strategy One
This is a long strategy.
Strategy Two
This is a short strategy
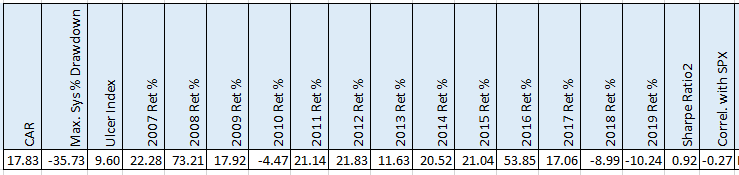
Seeing lower CAR and an MDD of 35%, one would think that combining this strategy would not help.
The correlation of the monthly returns of these two strategies is -.11
Combined Results with Monthly Rebalance and Shared Pool
The table shows various allocations for each strategy. The highlighted rows are the two strategies by themselves.
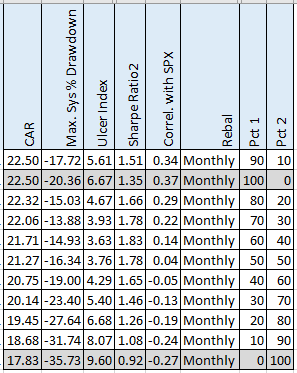
Looking at the 50/50 allocation we have a slight decrease in CAR but the MDD is reduced by 20% and the Sharpe Ratio is increased by 32%. This is a benefit of trading more than one strategy.
Combined Results with Yearly Rebalance
How does the separate equity pool with yearly rebalance compare to the previous results?
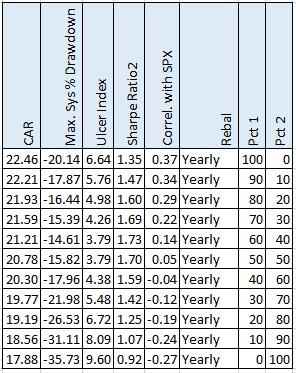
You can see in the above table that the results are not that different from the rebalancing on a monthly basis.
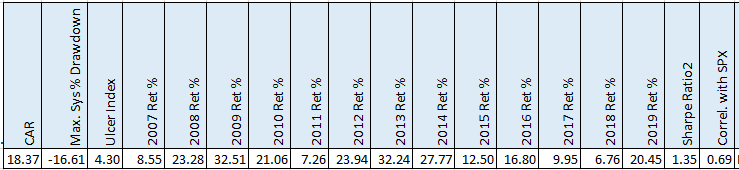
Strategy 3
Let’s add one more long strategy.
Correlation Matrix
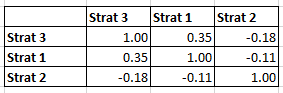
We can see that nee Strategy 3 is a little correlated with Strategy 1 but uncorrelated to strategy 2.
Three Strategies with Monthly Rebalance
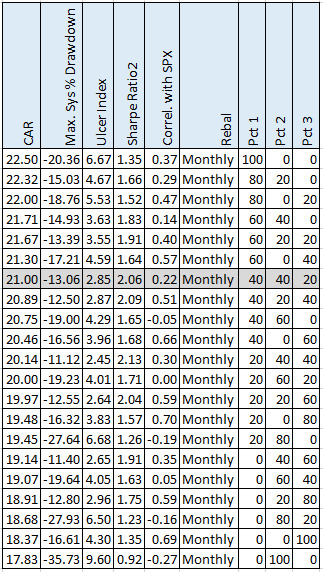
Looking at the first row that has allocations to each strategy, it is the one that is 60/20/20. In this case, the CAR and Sharpe Ratio go up compared to anyone strategy while the Ulcer Index and MDD go down.
The beauty of strategy diversification!
Multiple Strategies Backtest and Optimization Code
The data for this post was created using my Multiple Strategies Backtest and Optimization Tool. For you AmiBroker users, this tool allows you to easily create and combine equity curves. Click here to read more about it.
Spreadsheet
Fill in the form below to get a spreadsheet with more combinations. You can see how different percentage allocations change the results.
Final Thoughts
Combining strategies can clearly improve your overall results. Even a strategy that does not look like that good by itself, like Strategy 2, really helped the combined portfolio results.
From the results the difference between using a shared equity pool and a separate equity pool was minor. Using the shared pool is so much easier for most traders. But for me, I want to be able to compare my live trading results with backtested results and a separate pool allows me to do that at a portfolio level.
As in backtesting a strategy, one needs to be careful of overfitting.
Backtesting platform used: AmiBroker. Data provider: Norgate Data (referral link)
Good quant trading,

Fill in for free spreadsheet:
