
- in ETFs , Market Timing , Research by Cesar Alvarez
SPX and Gold Momentum Portfolio
Given the current rise in inflation, there has been a lot more interest in assets that do well during these times. Gold is one asset that is frequently brought up as an inflation hedge. I have also seen more lately about combining these two into a portfolio.
Testing Notes
The test range is from 1970 to 2021 using $SPX (S&P 500 Index) and @GC (Gold – London PM Fix) from Norgate Data. A couple of issues with these selections. For $SPX, this does not include dividends. The symbol $SPXTR does include dividends but that data does not start until 1989. For @GC, I looked at &GC (Gold Continuous Contract) but does not start until 1979.
I could have gotten fancy and switched between symbols as the data became available. Or tried to source the data externally but this is a proof of concept test. For me, using these two symbols was good enough
Buy and Hold
First, let’s look at what buy and hold looks like for each of these individually.
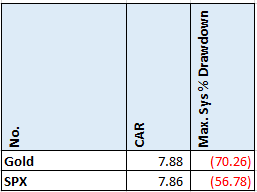
I was surprised to see the CAR being almost identical. But remember there are no dividends included in these results. To show you what the difference can be. From 1989 the CAR for $SPX is 9.0 while the CAR for $SPXTR is 11.4.
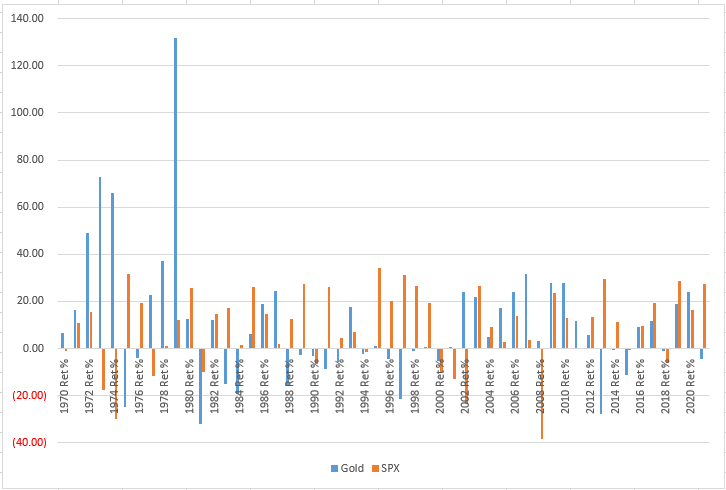
Here we have the yearly breakdown of returns which we can see can be volatile.
Quarterly All-In Momentum Portfolio
Rotation Rules
- At the end of each quarter (Mar, Jun, Sep, Dec), determine which asset has performed the best over the quarter.
- Buy that asset on the open of the next trading day
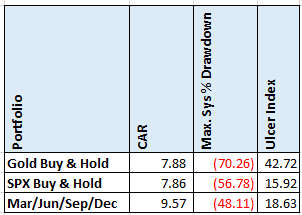
This was surprising to see. Improvement in both CAR & MDD. I added Ulcer Index because it captures both drawdowns and drawlengths. While that did not improve compared to Buy and Hold, it only got a little worse. This is a good start.
But what about changing the signal months?
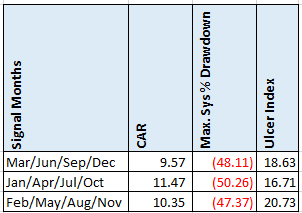
Good to see that the other rotation periods held up.
Monthly All-In Momentum Portfolio
For rotation portfolios, I prefer to check them every month. One, I don’t want to be in the underperforming asset for a long time. Two, I don’t want to be subject to the luck of which rotation months I pick.
Rotation Rules
- At the end of each month, determine which asset has performed the best over the last month.
- Buy that asset on the open of the next trading day
I changed to performance lookback window to one month because that is how frequently I am trading. The downloadable spreadsheet will also include a 3-month lookback.
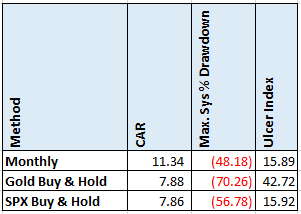
A substantial improvement in CAR & MDD.
Partial Allocation Portfolio
My next thought was what if instead of allocation 100% to better performing asset, we instead allocated 80% to better one and 20% to the other. Would this help with the MDD, which is high?
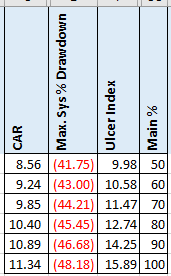
Some reduction in MDD but not enough to compensate for the CAR reduction. The spreadsheet includes more percent allocations.
Spreadsheet
Fill in the form below to get the spreadsheet with lots of additional information. See the results of all variations from the optimization run. This includes top drawdowns, trade statistics and more.
Final Thoughts
Gold is an interesting trading asset. I used to be in the camp that did not want to trade it because the value assigned to it seemed arbitrary. Testing it on rotation portfolios slowly convinced me it can have a place in a portfolio. It can help reduce drawdowns and increase returns. Now, I would not be a buy and hold trader of it.
These results show that in the many ways gold and SPX were combined, in general the results were much better than simply buy and hold.
Potential future research. How much of this out-performance comes from the 1970-1987 performance in gold? What if we only tested from 2000 or 2010? Gold did have another good run from 2005 to 2012.
Unfortunately, GLD is not doing so well this year. It is down 1% YTD as of May 13.
Backtesting platform used: AmiBroker. Data provider: Norgate Data (referral link)
Good quant trading,

Fill in for free spreadsheet:
