
- in Mean Reversion , Research , Stocks by Cesar Alvarez
Volume and Mean Reversion Part 2
From the Volume and Mean Reversion post, a reader sent a suggestion to instead use the ratio of 10 day moving average of the Close times Volume divided by the 63-day moving average of the Close times Volume (CV10/63). I had not tried this before and wanted to see how well it would work.
First Steps
I decided to follow the same path as the previous post. First testing on a very simple mean reversion strategy and then took what I learned from that and applied it to my own mean reversion strategy that I am trading. These results produced nothing interesting.
On reflection, I applied CV10/63 to the mean reversion strategy I trade from the beginning of the analysis. First, I would generate data gathered from all trading signals and then apply what I find to the portfolio.
All Signals
Results Above the 200-Day Moving Average
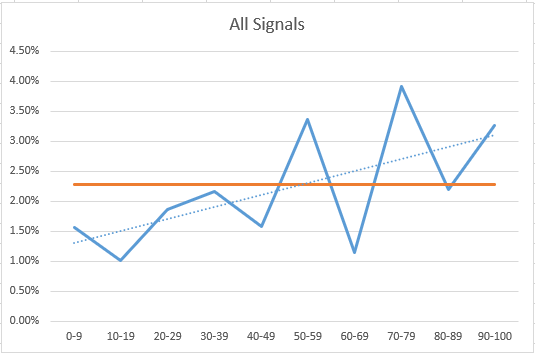
The blue line is the avg % p/l for each PercentRank bucket. The dotted line is the trendline. The orange line is the average % p/l for all trades, 2.28%. The lower PercentRank ratio is clearly below average while those above 50 are above average. I like seeing charts like this.
Looking at the trades with PercentRank < 50, we have an avg % p/l of 1.58% while those above 50 have an avg %p/l of 3.03%.
But do we run into the issue of the number of trades like in the original post?
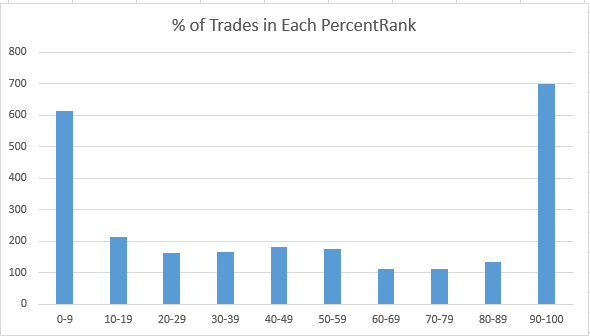
Looking at PercentRank 0-50, that is 52% of trades. That is good. The end buckets have a lot of trades but overall, they are good numbers.
Adding Findings to the Portfolio
These findings could be applied in two ways. First, I could use the CV10/63 as a signal ranking. My current strategy uses 100-day historical volatility. The second would be only taking trades with a PercentRank above 50.
As Ranking
When testing a new indicator, CV10/63, for ranking of signals, I will test it both high-to-low and low-to-high ranking. What I want to see is a difference in the results. This gives me confidence that the indicator is working. Here I expect ranking from high-to-low to give me better results.
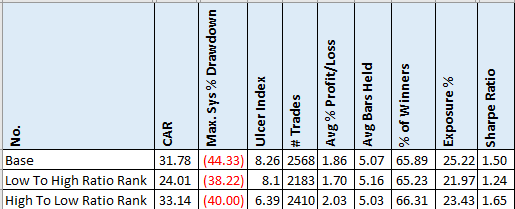
We can see that the CAR is the much better ranking from high-to-low than low-to-high, which is a good sign. Though the CAR is not that much better than using HV100. But the Avg %p/l is much bigger.
As Signal Filter
Going back to using HV100 as the ranking and now we will test using PercentRank as a signal filter. We will test only taking trades when PercentRank is less than 50. And also test when PercentRank is greater than or equal to 50. We expect the latter to do better.
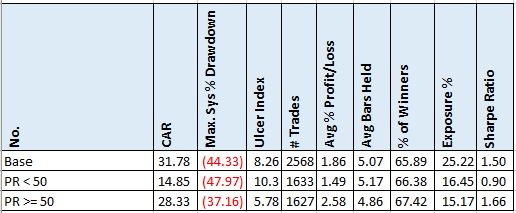
Now, these results are even better. PR >=50, has the CAR come down about 10% but that comes with a 15% drop in MDD and a 40% drop in exposure. While avg %p/l increases by 39%. Now I am getting excited, is volume finally working for a mean reversion strategy?
As Ranking and Signal Filter
Now, what if we combined the two results? We use CV10/63 as the ranking and use PercentRank as a signal filter.
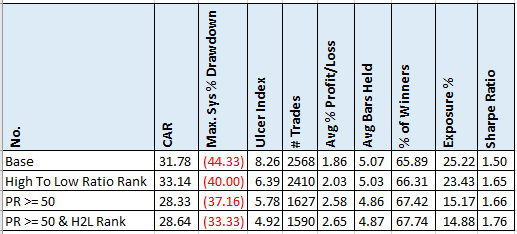
Wow! These results are really good. CAR drops by 10% but MDD drops by 25%. While avg %/pl increases by 42% and Sharpe Ratio by 17%.
At this point, I was really excited and not sure where to go next. Do I test for parameter sensitivity to see if these are curve fit values? Or do I try this on other mean reversion strategies?
On Other Mean Reversion Strategies
Being lazy, I tested this on other mean reversion strategies first. I tested this on Big Cap Alpha, which is a strategy in my private trading group The Crew. It is not a normal mean reversion strategy but it has a very strong mean reversion component. Disappointment. It did not change the results at all.
Even though I am not happy it did not improve the results, I am not too concerned about it because it is not a typical mean reversion strategy.
I had completed testing a ‘typical’ mean reversion strategy for a client. Conceptually it shared a lot of the same ideas as my mean reversion strategy. I dropped the rules into the strategy. And again, no improvement in the results.
AmiBroker Code
ratio = MA(V*C,10)/MA(V*C,63);
PercentRank(ratio, 20) < 50;
PositionScore = ratio;
Final Thoughts
At this point, I need to take a step back and understand what is going on. Did I get unlucky when first evaluating this in that the data appear to give a clear indication? Or is there something special about my strategy that this indicator works on?
I have not given up yet on using this volume indicator. Unlike earlier testing on using volume on mean reversion, this gave very promising results.
If you have a mean reversion strategy, I recommend you try this indicator on your strategy and see if it helps.
Backtesting platform used: AmiBroker. Data provider: Norgate Data (referral link)
Good quant trading,
