
- in Mean Reversion , Research by Cesar Alvarez
Efficiency Ratio and Mean Reversion
While reading the January 2023 issue of Technical Analysis of Stocks & Commodities, I came across an article about Efficiency Ratio (ER) by Perry Kaufman. In the article, he discusses using ER to decide when to trade mean reversion strategy vs a trend following one.
My curiosity on this was could I use the ER to filter trades in my mean reversion strategies.
Efficiency Ratio
ER is calculated as the absolute total change in price over N-days divided by the sum of absolute daily price change over the N-days. This gives a value of between 0 and 1. Then multiply by 100 to cover the value to between 0 and 100. The lookback N is typically between 10-20 with 10 used in the article.
Lower values are supposed to mean that it is a good time to be trading mean reversion strategy. While higher numbers mean one should trade a trend following strategy.
What I wanted to know, is given a mean reversion setup, can I use the ER as a filter to remove poorer performing trades? To do this and remove some of the noise in ER, I add a moving average to the ER.
AmiBroker Code
lenER = 10;
er = Nz(100*(abs(C-Ref(C, -lenER))/Sum(abs(C-Ref(C,-1)), lenER)), 50);
erMA = MA(er, lenER);
Chart
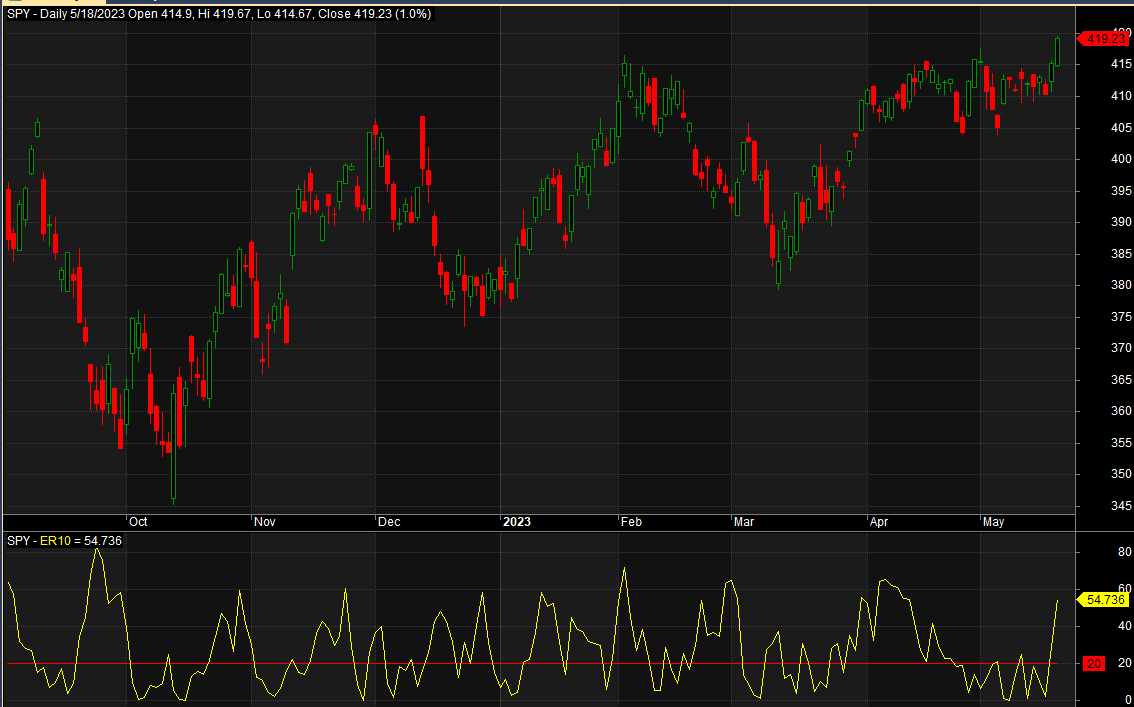
The red line is a value of 20 which I will use later. Given this chart, I did not see any patterns.
All Trades – Mean Reversion
I took my mean reversion strategy and looked at all the trades it generated without consideration of trading a portfolio. For each trade, I calculate the ER on the setup day. I then created a table of the ER ranges and the avg % p/l for each range.
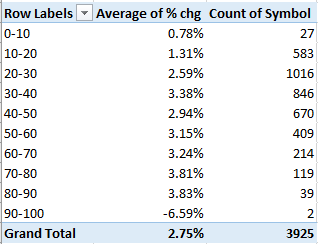
There are 3925 trades with an avg %p/l of 2.75%. What surprised me is that the results are the opposite of what I expected from reading the article. The higher ER stocks have better returns. Those with an ER below 20, have returns less than average.
What happens if I add a rule to my strategy that the ER must be greater or equal to 20?
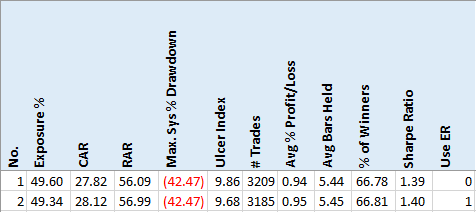
Portfolio
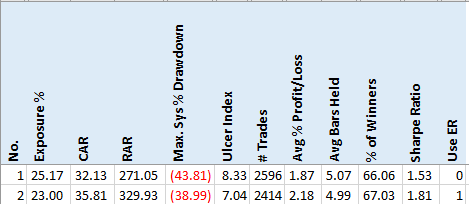
The first row is the original strategy and the second with either the ER >= 20 filter added to the setup.
Wow, this never happens. Every major metric I look at improved. Exposure goes down, CAR goes up, MDD goes down, UI goes down, avg %p/l goes up, avg bars held goes down, % winners goes up and Sharpe Ratio goes up. The one that caught my attention is the 15% improvement in avg %p/l.
Another Portfolio
Working on my strategy is great but it is important to see that this works on another strategy. I added this filter to a client’s mean reversion strategy (with permission).
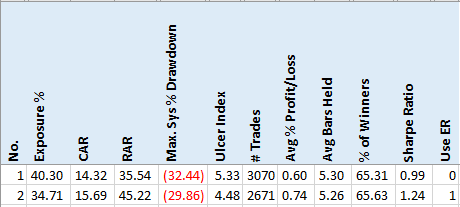
Again, the same thing. All stats improve. You are getting the same return with less exposure.
Yet Another Portfolio
A different client’s mean reversion strategy (with permission) is shown below.
Now we have no improvement. What is interesting is that the trades only dropped by 24. Looking at the rules nothing obvious jumped out at me that another rule is like ER. Disappointing that the results did not improve but at least they did not get worse.
Final Thoughts
I am very excited about the Efficiency Ratio as a filter for mean reversion strategies. Before adding it to my strategy, I need to do parameter sensitivity analysis. But given this clearly worked on two strategies gives me hope that it will pass further testing.
Am I worried that it did not work on the third strategy. A little. I will spend more time trying to understand why.
This test shows why one should not blindly follow how an indicator is supposed to work. Had I only tested adding a filter for low Efficiency Ratio stocks, I would have missed out on the discovery that one wants to avoid those stocks.
Backtesting platform used: AmiBroker. Data provider: Norgate Data (referral link)
Good quant trading,
