- in General by Cesar Alvarez
AI Backtesting – How good is it?
I was given access to Trading Breakthroughs with AI by Algo Advantage on using Claude Code as a research assistant for systematic trading. The idea is simple. You come up with the idea to test. Claude writes the code, runs the backtests and writes up the results. What caught my attention is that the course is built around the author’s own instruction files, the rules that tell Claude how to build a strategy, how to optimize without overfitting and what mistakes to avoid. It loads the full RealTest documentation so Claude can answer platform questions instead of guessing. I had questions going in. Does the AI save time? How much can it help with idea generation? Would this work without having to know how to program RealTest? How good is it?
Setup
The tools used are Claude Code Pro, RealTest and Norgate data. A couple of important notes on these tools. You need a paid Claude plan. If you are comfortable with AI, you could probably adjust this to use another AI coding platform but it will be some work. RealTest is central to the setup. In theory, you could have AI write Python code instead but that would require a lot of changes in the instruction files. The course does give instructions for using a different data provider. But I highly recommend using Norgate data. They have been my go-to provider for years.
The first part of the course walks you through setting things up. The course does a great job on the steps to do and gives you the prompts to copy and paste to have Claude just do it for you.
Instruction Files
The instruction files are instructions to the AI on how to do backtesting, avoid overfitting, producing reports and documenting the backtesting process. The course recommends at least skimming these files. I would recommend that you read them. Those files are a great course on how to do backtesting.
AI Backtesting
I wanted a simple test to try and share here. I decided on this blog post, ETF Sector Rotation. I would start with the first part of the post and see where AI guided me from there. I was not expecting to create a tradable strategy but more wanted to learn how to interact with the AI. Would it be helpful?
Initial prompt:
I want to test a ETF Sector rotation strategy. It will trade these ETFs: XLY, XLP, XLE, XLF, XLV, XLI, XLB, XLK, XLU. The testing period is from 2008-2025.
At the end of the month, rank the ETFs from high to low of their X month returns. Buy the top N ETFs on the next open. For X use 6, 9 & 12. For N use 1 & 2.
Run the test on daily bars.
This will be the base test. From the results we will try more ideas. After seeing the results, suggest your own ideas of what else to test.
My goal is to match CAGR of SPY buy and hold but with half or less of the max drawdown.
Any questions?
Claude asked some good clarifying questions. Then went and wrote the code with the following results and comments.
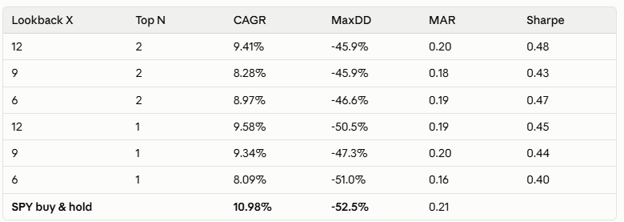
What the results say:
2008 is the main problem. Every sector fell together, so the best one still dropped 38–44%. Ranking can’t avoid a market-wide decline, which I expected when we set this up.
2020 is the second problem. The COVID crash caused a 30–33% drawdown in every combination. That crash happened within a single month, so a monthly check can’t react in time.
Holding 2 ETFs is steadier than holding 1. CAGR is about the same, but drawdowns are 4–5 points smaller and returns are smoother (lower Ulcer Index). Holding 1 depends on a few big years: 2022 alone was +64% from holding XLE.
The lookback choice makes little difference (8–9.6% CAGR, no clear winner), and year-by-year results swing a lot between settings. Treat them as roughly equivalent rather than picking the best one.
What I’d test next, in order:
1 Move to cash when momentum turns negative. Only hold a top-N ETF if its own X-month return is above T-bills; otherwise hold cash. This targets 2008 directly and is the most likely single step toward your drawdown goal.
2 A market trend filter. For example, go to cash when SPY closes a month below its 10-month average. Test this as an alternative to idea 1, not on top of it.
3 Bonds instead of cash for the defensive position (IEF, TLT or SHY). This recovers some return while out of stocks, but 2022, when stocks and bonds fell together, will be a hard test.
4 Size by volatility (target about 10–12% annual volatility, or weight inversely to volatility). This is the one idea that can soften a 2020-style crash that happens inside a month.
5 Average several lookbacks (for example 3/6/9/12 months, or 12 months skipping the latest one), and hold the top 3. Since no single lookback is clearly better, averaging should cut the dependence on one choice.
6 Check whether the rebalance day matters by rebalancing a few days after month end. If results change a lot, part of the edge is luck of the calendar.
I really like that it gave an analysis of the results. The ideas it gave are all very good.
Next, I asked it to test idea 1 and got back these results and comments.
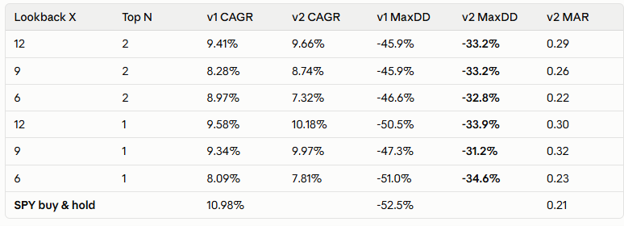
What happened:
The filter only acted during 2008–09. From 2010 to 2025 at least one sector was always beating T-bills, so the strategy was never in cash. For the 12/1 setting that meant cash from October 2008 to October 2009. The whole improvement comes from that one episode. That makes it a single data point: the idea makes sense, but this backtest can’t prove it.
The filter was late getting out in 2008. XLE’s 12-month return stayed positive until September 2008, so it rode XLE down about 22% before moving to cash. Shorter lookbacks exited sooner but also came back in too early in 2009.
2020 now sets the max drawdown for most combinations (29–33%), and this filter can’t fix that. The COVID crash came and went within about a month, while 12-month returns were still positive, so the strategy stayed fully invested. Idea 2 (the SPY 10-month average) is also checked monthly and would have missed it too.
The 6-month lookback is the weakest in both versions. The 9- and 12-month results sit close together, which is a reasonable sign they aren’t fitted to noise.
More good analysis. Now I wanted to see if how it would pivot with a new request. Here is my prompt:
Go back to V1. Test only Lookback=6 and Top=2. For the top 2, only enter if it is above the K-month moving average. For K test 6, 10, 12. If not, then go into cash.
And the results and analysis.
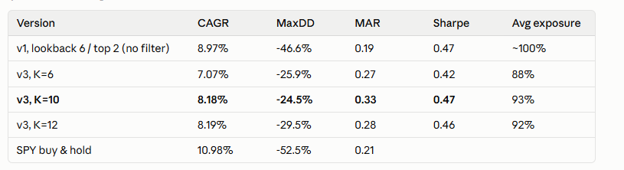
What the filter did:
2008 was roughly halved: the year’s drawdown went from 42% to 22% for every K, and the year’s return from -35% to about -19%. Sectors dropped below their moving averages during 2008 and the filter moved them to cash. This is the real, repeatable benefit.
2020 is where K=10 got lucky. At the end of February 2020 the top 2 were XLK and XLU. XLU closed that month just 0.04% below its 10-month average, so K=10 sold it and missed XLU’s roughly 10% drop in March. With K=12 the average sat lower, XLU stayed, and the 2020 drawdown was 29.5%. The difference between “meets the goal” and “misses it” is one month-end close missing by a hair. Expect the future drawdown to look more like K=12’s 29–30%.
The costs: false exits in choppy markets (2010’s drawdown got worse, 19% → 23%) and slower gains in rebounds (2020 return +17% vs +30% with no filter). K=6 is the worst: too many false exits, and -10% in 2022.
Fast crashes still get through. 2025’s 23% drawdown, from the April tariff sell-off, is identical with and without the filter, because everything happens between month-ends.
Where the goal stands: in both v2 and v3, the month-end filters fix 2008-style slow bear markets. Neither handles fast crashes (2020, 2025), and both cost 1–3 points of CAGR because they add cash drag to a rotation that was already below SPY. Two things now look necessary:
Something that reacts faster than month-end, such as volatility-based sizing or a daily exit trigger, to deal with fast crashes.
Something that adds return, since even v1 without any filter is about 1.5–2 points below SPY. Holding bonds instead of cash (idea 3) would make the cash periods earn something, and averaging several lookbacks would make the ranking less dependent on one setting.
I like how it says K=10 got lucky and why. That is something I probably would not have caught. I am enjoying this process. Now to something complicated as in the post. Next prompt.
Go back to V1.
Rank1 = rank the ETFs from high to low of their (3,6,9,12) month returns
Rank2 = rank the ETFs from high to low of their (3,6,9,12) month returns
Rank3 = Rank1 + Rank2
Final rank is rank3. In case of ties, use Rank1 as the tie break.
Buy the top 2 ETFs on the next open
But if the ETF is below the their 200 day moving average, then instead of buying the ETF stay in cash
Results and comments from Claude.
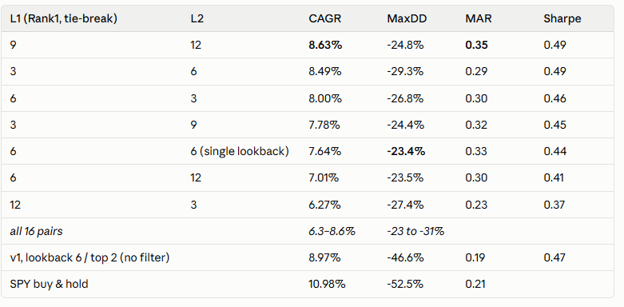
What the grid shows:
Combining two rankings doesn’t help. The 4 single-lookback rows (L1 = L2) average 7.4% CAGR, and the 12 mixed pairs average 7.5%. Drawdowns are only slightly better (about 26% vs 27%). The best pair, 9/12, is 0.3 points above its neighbours, which is within noise. I wouldn’t pick it for that.
The 200-day filter does the drawdown work, much like v3’s monthly moving average. 2008 falls to 22–28% (v1: 42%).
2020 is -21.2% in every pair, and it’s the same borderline call again. At the end of February 2020, XLU closed just 0.45% below its 200-day average, so every pair sold it before its March drop. The margin is wider than v3’s 0.04%, but it is still close to a coin flip. XLP and XLV were also below their averages, which suggests defensive sectors were genuinely weakening. Even so, I wouldn’t count on catching the next fast crash this way.
All the filters cost return. v1 without any filter made 9.0%; v4 averages about 7.5%. That’s about 1.5 points of lost CAGR paid for roughly 20 points less drawdown.
Where the goal stands: the drawdown half is roughly met; the CAGR half isn’t close. Nine equal-weighted sectors haven’t kept up with a market-weighted SPY from 2008 to 2025, largely because tech dominated SPY’s returns. Two things could close the gap:
Hold something instead of cash when a slot fails the filter: IEF, TLT or GLD, or whichever ranks best. The strategy is out of the market 8–10% of the time, and that cash earns close to nothing.
Add SPY (or QQQ) as a 10th candidate in the ranking. Then the strategy only picks sectors when they are actually beating the market, instead of being forced into two sectors.
More good analysis and suggestions on what to try next. This can go on endlessly just like when I am backtesting on my own. I did continue on. Some analysis it gave about parameters being on the knife edge was good to see. This did feel like I was working with a version of myself that understood backtesting and the pitfalls.
Files Produced
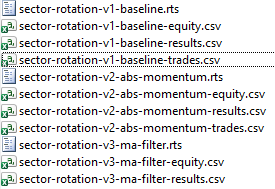
What I like is that after every test, there is a set of files produced in a consistent manner that lets you easily see what is going on. These files include RealTest code, equity curve data, trades data and optimization results. You can also have a briefing doc created, which is a summary of all that has been tested along with ideas to test. I find these files very useful.
No Backtesting Instructions
What you get from the course are instruction files that help guide Claude on how to test, avoid curve fitting, organize the results and more. I tested this ETF idea using the same prompt in Claude Code without using these files or RealTest. I told Claude to use Python and Norgate data.
The Python version did give similar analysis of the tests and suggestions on what to try next. But this interaction was not as good as with the instruction files. Could you do a good backtest without them? Yes, but it would require more guiding work from you. If I were doing this, I would slowly start creating these instruction files as I went to minimize future guiding. Also, the files created are not as well organized. Again, this could be done with your own instruction files. The course saves you the time and debugging to get these files.
Final Thoughts
First, it was possible to do this testing without knowing any RealTest coding. That was great to confirm. There probably would be cases where the Ai ran into problems and knowing RealTest coding would help. But I did not run into here and other testing I have done.
The course and the files provided were very useful. I will continue to use them for initial testing of trading ideas. For me, once I get to a certain point, I will move over to doing the code myself in AmiBroker. This would be my verification step and allow me to continue to test. I still like to get my hands dirty in the code. I also use this tool as a verification for code that I have written first in AmiBroker.
Since the course has come out, he has continued to improve on the instruction files. He made a big update just after I finished writing this review. I look forward to trying the new changes.
The biggest downside to this course is that you cannot buy it directly. It comes as part Alpha membership to the Algo Collective, which is currently on sale for about $460. The site provides a lot of tools and courses for traders. At the current sale price, I would buy it. Between the AI course (with the time saved in creating the instruction files) and all the resources available on the site, it would make a good trading education investment.
Answering the questions posed in the first paragraph.
Does the AI save time? Yes it does. Claude can write code very fast
How much can it help with idea generation? Not with the initial but it definitely helps with new ideas to try after a test.
Would this work without having to know how to program RealTest? Not without a lot of work
How good is it? Very good. Way better than I expected.
Disclaimer: I received access to this course for free. I receive no compensation for any sales made.
Good quant trading,