
- in Research by Cesar Alvarez
2023 Rally – How Strong Is It?
This end of year rally which started on October 2023 has been strong. My trading buddy and I started wondering how this compares to the past. Is this a “normal” strong rally or an “abnormally” strong one?
Determining this is always tough because it depends on the indicators you use. Because of that, I tried lots of them. This will be a post short on words but with lots of tables.
Where are we now?
Data is from 1/1/1980 to 12/19/2023. The close of 12/19/2023 was the 36th day of the rally. These are the stats based on these last 36 days.
- 18 days with RSI2 over 90
- 6 days with RSI2 over 99
- 20 days with RSI4 over 80
- 27 days with the close above the previous day’s close
- 5 days with close above the upper Bollinger Band(15,2)
- 15.8 total return in those 36 days
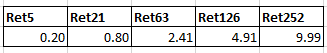
Over the last 44 years, these are the average returns for all days for 5, 21, 63, 126, and 252. My main focus is on 126 & 252 days later.
For each of the above stats, we will look at when it happened in the past and how the market did later. I ignore signals that happen within 21 days of the last one.
RSI2 over 90 for 18 days out of 36 days
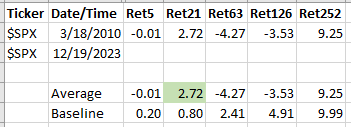
Wow, this has only happened once in the past. A green cell indicates that it does better than the average of that hold period.
RSI2 over 99 for 6 days out of 36 days
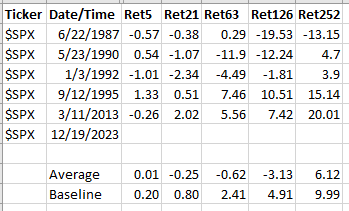 Again very rare with 5 events in the past.
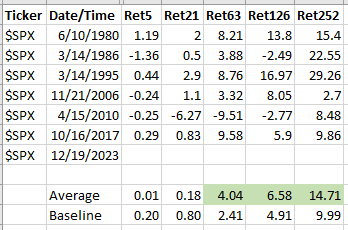
RSI4 over 80 for 20 days out of 36 days
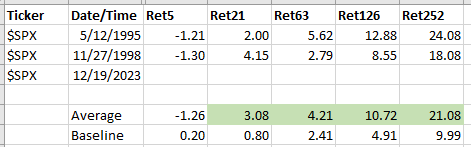
Only two times in the past has this happened. But not since 1998. Though those two times produced great gains 126 & 252 days later.
Close above previous close 27 days out of 36 days
Six occurences and on average market did well 126&252 days later.
Close above the upper Bollinger Band 5 days out of 36 days
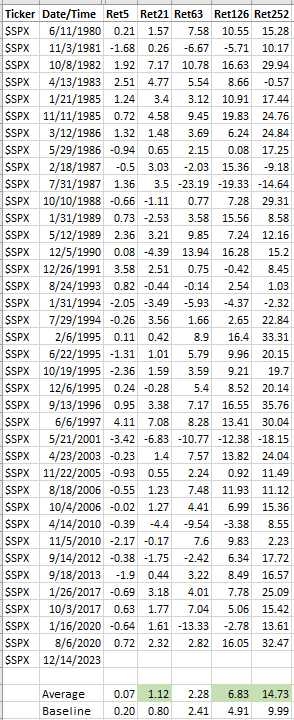
This has happened 36 times before. A much larger sample and on average market did well 126&252 days later.
Total return in those 36 days over 15.8%
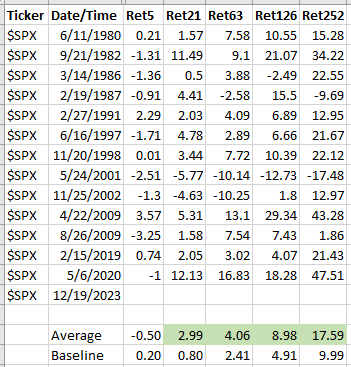
This has happened 13 times with on average market did well 126&252 days later.
Final Thoughts
Overall this is an “abnormally” strong rally given that most of the indicators did not have many past occurences. In many ways, this rally is stronger than market thrusts of the 2003, 2009 and 2020 market lows. Comparing the average returns to the baseline returns for most of the tests seems to indicate significant outperformance 6 and 12 months out. But these are small sample sizes and in a couple of cases, the market was down significantly a year later.