
- in ETFs , Rotation by Cesar Alvarez
Sector Rotation Strategy: Should Trading Rules Make Sense?
I was doing my usual reading when I came across a sector rotation strategy. I have seen lots of these strategies but this one had a different twist. The strategy was a momentum strategy but instead of buying the top three, it was buying the middle three. The article gave no reason other than it works and gives the best results.
In general, people fall into two camps about trading rules.
- The trading rules need to make sense on why they are there.
- Don’t care about the rules if the stats are good and over-fit tests pass.
The Strategy
First, I needed to replicate the results and test different parameters.
Buy Rules
- ETF is one of the following SPDR ETFs: XLB, XLE, XLF, XLI, XLK, XLP, XLU XLV, XLY.
- It is the last trading day of the month
- Rank all the ETFs by their 1-month return. With the best return having a value of 1.
- Buy ETFs ranked 4, 5, 6 in equal amounts on the next open
Sell Rules
- Sell all previous month’s ETFs.
Very simple and mostly standard sector momentum strategy. But why buy 4,5,6? Here are some ‘reasons’ on why.
- Rank 1, 2, 3 are overbought and about to sell off. But momentum usually begets momentum.
- Rank 4, 5, 6 are starting their momentum run. But they could also be on their way down.
Now a rule I have seen and makes a little sense, is avoiding the top ranked one because it is usually overbought. I am wondering how that idea will work.
Results
Test range 1/1/2010 to 9/30/2023. The original article tested from 2001. I wanted to focus on a more recent period to see if the results still held up.
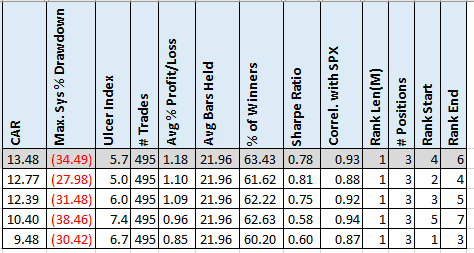
From a CAR perspective, buy 4,5,6 produces the best results. What I find the most interesting is that buying 1, 2, 3 gave the worst results for CAR and Sharpe Ratio by quite a bit. Another interesting result is that avoiding the top ranked and buying 2, 3, 4 also produced results comparable to 4,5,6. This gave better MDD and Sharpe Ratio.
Different Ranking Length
The spreadsheet has results for different ranking lengths of 1, 2, 3, 4, 6 months, different numbers of positions 2, 3, 4, and different rank starts.
Ranking by 3-month return gives us the following.
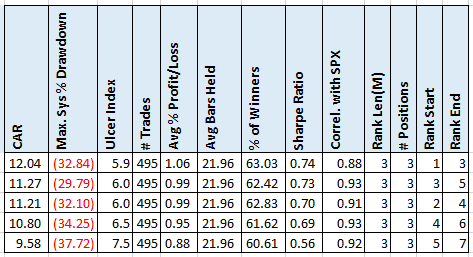
Now rank 1,2,3 gives the best overall results but notice that they are closer together.
And if we rank by 6-month return.
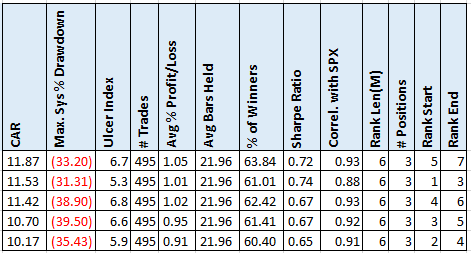
They get even narrower. This tells me that the shorter ranking is making a difference.
Buy & Hold
Here are the results of buy and hold the SPY
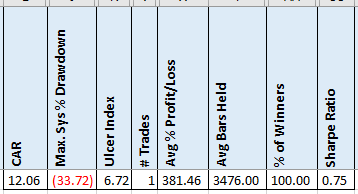
Only slightly less CAR & Sharpe but with a lot less work. Unfortunately, this is a pattern I am seeing increasingly of. The markets of the last 13 years have been hard to beat the simple buy and hold from a return perspective. I also care about drawdowns and given we have not had what I would consider an extended bear market during that time also makes it difficult.
Spreadsheet
Fill in the form below to get the spreadsheet with lots of more information. See the results of all variations from the optimization run. This includes top drawdowns, trade statistics and more.
Final Thoughts
I am in mostly in camp 1. We have been having a good discussion on this topic in my private trading club, The Crew. A member came up with an interesting analogy about driving a car. How much do you need to know about the internal workings of the car in order to have confidence it will get you where you want go? For a car, I like knowing at a high level how things work. For a strategy, I need not know exactly why each rule is there but need to have high level understanding of it. I need to know that a strategy is not sensitive to changes in the parameters and did fine in out-of-sample testing.
It would be hard for me to trade this strategy even with really good results. Now, there is nothing wrong with camp 2. The numbers would have to be really compelling for me to take this strategy seriously. Now does this mean, I would not trade a black box strategy? It depends on how opaque it is. Strategies that use machine learning can be very opaque on understanding how parameters were selected and are usually parameter sensitive. This I would not trade. I would trade a signal service, if I had confidence in the person who created the strategy and was given a high-level concept of the strategy.
The most important reason for me being in camp 1 is that I need to understand why trades are happening in order to trade a strategy when things get tough. Sticking with a strategy, no matter the rules, is easy when it is making money. But it is when it is losing money, that I need to understand why I am taking the trades.
Backtesting platform used: AmiBroker. Data provider: Norgate Data (referral link)
Good quant trading,

Fill in for free spreadsheet:
